


October 27, 2026
Risk and Return
Dispersion Is No Excuse

That’s a Good Question
Our friend Greg Zuckerman, the WSJ reporter and author, recently asked us about a puzzle.
Over the past 20 years, about 70% of actively managed US equity mutual funds have underperformed a comparable index fund in an average year.1 Active managers often blame index funds for this. The argument goes that indexing makes stocks move together, and if every stock performs in lockstep there would be nothing to pick. The second half of that is true: if all stocks have the same total return, no stock-picker could beat the index, even one charging no fees. But whether indexing has actually made stocks move together more than they used to is debatable.
Greg pointed out that for the past three years, individual stocks have been unusually independent of one another, which should be the stock-picker’s ideal environment. So here’s the puzzle: in each of those three years, about 70% of active funds still underperformed their closest matching index fund, right at the long-term average. Why hasn’t the high dispersion helped? Greg wanted to know what we made of it.
Bigger news overtook the story, so our answer didn’t make the WSJ. But we thought it was a great question, and worthy of a short article.
Dispersion and Active Management
Dispersion describes how much individual stocks do their own thing. When dispersion is high, some stocks go up while others go down, and correlations between them are low. Conversely when dispersion is low, stocks move together more.
One measure of dispersion is the CBOE 3-Month Implied Correlation Index, which goes back to 2009, shown in Figure 1.2 Because it measures correlation, a low reading means high dispersion.
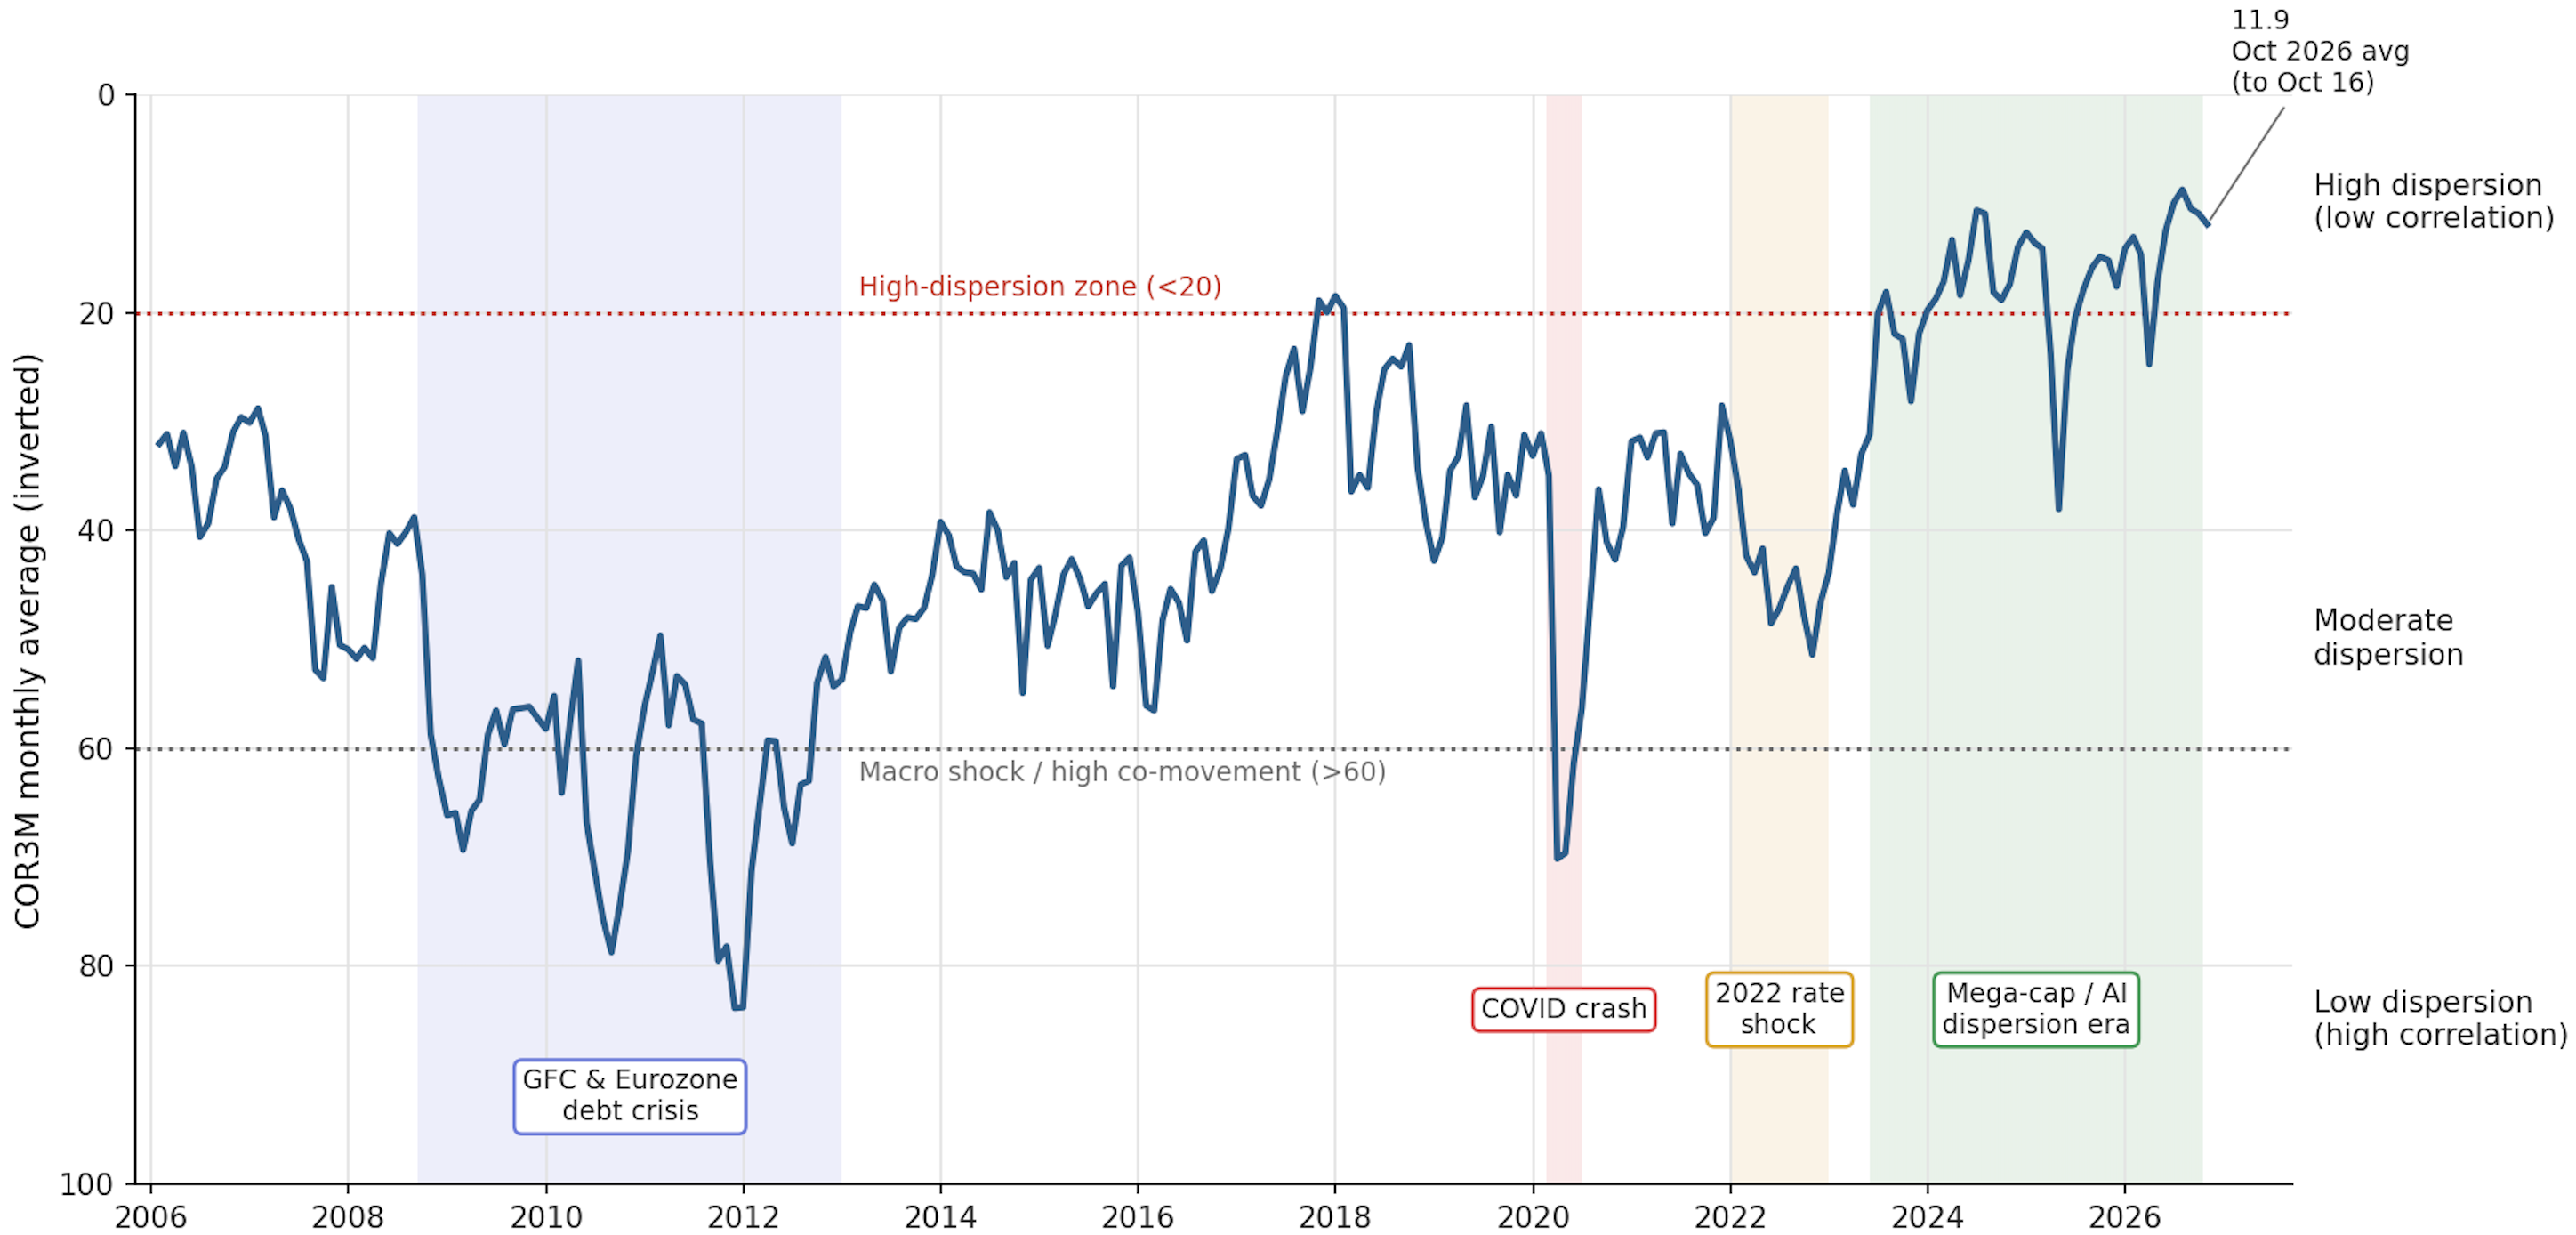
Figure 1: CBOE 3-Month Implied Correlation Index. Lower correlation means higher dispersion.
Until a few years ago, dispersion was moderate to low, and very low during the two crisis periods in the sample. But for the past three years dispersion has been high. One likely reason, though not the only one, is that AI has been great for some companies, and bad for others.
The next chart, Figure 2, sets dispersion against the percentage of active funds that beat their index fund each year.
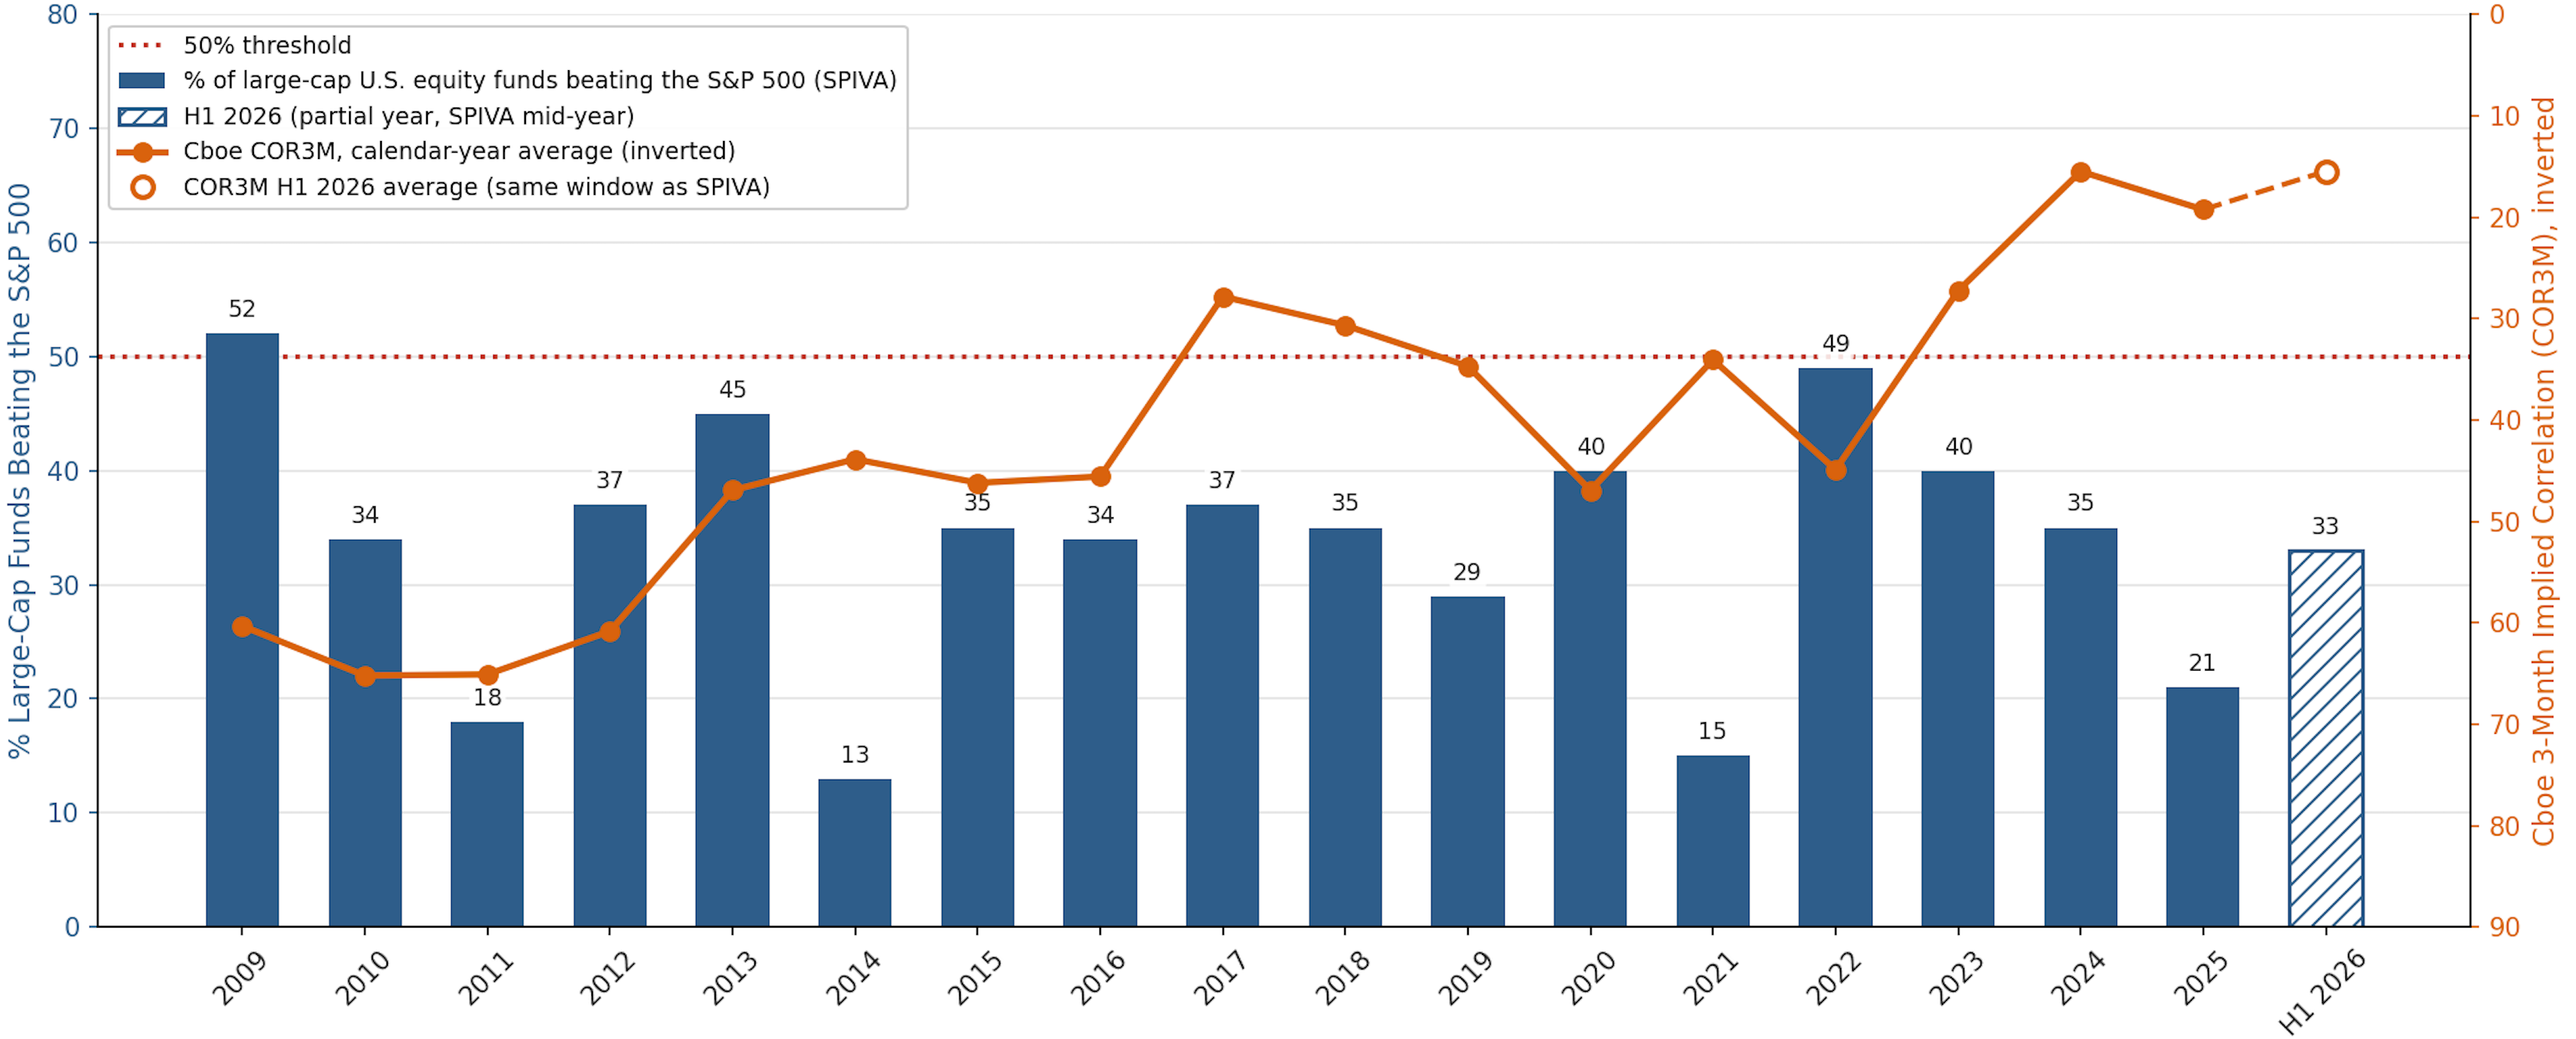
Figure 2: Dispersion and the percentage of active US equity funds beating a comparable index fund, by year.
The correlation between dispersion and the share of funds beating their index is \(-0.15\): when stock returns were more independent of each other, slightly fewer funds won. The relationship is weak, but in the opposite direction of the conventional story. With fewer than 20 annual observations we can’t rule out that dispersion has no effect at all, or that it goes in the other direction. As we’ll explain now, there’s good reason to believe that dispersion should have little effect on how many stock-picking active managers beat their indexes.
Sharpe’s Arithmetic
A better starting point for thinking about the performance of active managers is William Sharpe’s 1991 paper, “The Arithmetic of Active Management.”3 Active investors, taken together, hold the market.4 So before costs, the average actively managed dollar must earn the market return. After costs, it must earn less. This holds whether stocks move together or apart. Dispersion can only change how widely active returns are spread around that average. It does not change the average active return. Vanguard founder John Bogle called it the “Cost Matters Hypothesis” and made it the cornerstone of his case for indexing.5
The spread of active returns does affect how many managers lose. If total returns moved in perfect lockstep, every manager would earn the index return minus their costs, and 100% would underperform. As dispersion rises, active returns spread out, skill and luck let more managers beat the index, and the share underperforming falls from 100%.
Sharpe’s arithmetic applies to active investors as a whole, and mutual funds are only part of that group. But empirical studies show that the aggregate portfolio of active US equity mutual funds closely mirrors the market, with only minor tilts, so the arithmetic applies to them very nearly as well.6 We assume the tilts are small enough not to change the conclusions that follow.
Suppose active managers, taken together, hold the market, are similar in size, all charge more than an index fund, and, before costs, have returns spread symmetrically around the market’s. Then it is mathematically impossible for more than half of them to beat an index fund, in any year, whatever stocks do.
So high dispersion can help, but only within those bounds. It can move the share of losers from 100% toward 50%, but never past it.7 And even that much requires managers to let dispersion work for them. Mostly they don’t.
Why Dispersion Doesn’t Help
Active managers are conventionally judged against a benchmark, and they manage their tracking error, which is the volatility of their return relative to that benchmark. Clients, consultants and in-house risk managers expect tracking error to stay within a fairly narrow band. When dispersion rises, the same positions generate more tracking error, so managers tend to shrink their bets. Our LSE friend Dimitri Vayanos has written about this behavior, and its impact, in several excellent papers.8
If tracking error stays constant, the share of managers who underperform is approximately:
Share underperforming ≈ N(CostsTracking Error)
where “costs” include fees and trading costs and \(N(\cdot)\) is the cumulative standard normal distribution function.9 With a cost disadvantage of 1.5% (fees of 1% and trading costs of 0.5%) and tracking error of 3%, about 69% of managers should underperform. That is close to what we observe. As tracking error shrinks toward zero, the formula gives 100%, the lockstep case from Sharpe’s arithmetic. Dispersion does not appear in the formula because managers holding their tracking error steady make it irrelevant.
Risk Matters Too
Sharpe’s arithmetic is about return. Our Risk Matters Hypothesis brings risk into the picture, and it doesn’t make the picture prettier.10 Active management is also a negative-sum game on risk, even before costs. Because active portfolios add up to the market, the average active portfolio is riskier than the market. That extra risk is uncompensated, idiosyncratic risk. Even a manager who matched the index return would, on average, deliver a worse risk-adjusted result.
High dispersion sharpens the dilemma. A manager who keeps position sizes unchanged takes on more uncompensated risk. A manager who cuts them gives up whatever help dispersion offered, and pays trading costs to do it. Either way, the investor loses.
Who’s on the Other Side
Mutual funds are not the only active investors. Hedge funds, pension funds, individual investors and trading firms are all active too. Sharpe’s arithmetic applies to all of them together. If trading firms such as Citadel, Jane Street and Hudson River Trading, along with bank equity trading desks, earn more when dispersion is high, as recent headlines suggest, that money largely comes from other active investors. Active mutual funds are probably among them.
Connecting the Dots
Low dispersion among individual stock returns was never much of an excuse for active managers, and theory says high dispersion is no remedy. We don’t have enough data to prove it, but what little we have agrees. Before costs, active management is a zero-sum game on return. After costs, it is negative-sum, and even more so after risk is taken into account. Managers who keep their tracking error steady neutralize whatever help higher dispersion offers, and pay to do it. We expect the roughly 70% of active funds underperforming each year to hold steady, whether individual stocks dance in step or to their own beat.
More from Elm on stock selection and Active Management
- Sharpe’s Arithmetic and the Risk Matters Hypothesis
- Concentrating on Concentration
- ETF Edge: Why most are likely to lose picking tickers
- How Elm Invests
The content on this page is being provided as general market commentary and for educational purposes only. It does not constitute any form of investment advice, or recommendation to buy or sell any securities or adopt any investment strategy mentioned herein. Any investment strategies and investment results discussed herein are for illustration purposes only in the context of the commentary, and do not reflect actual or hypothetical Elm Wealth strategies or results, or an offer to provide such strategies or results.
This content is intended only to provide observations and views of the author(s) at the time of writing, both of which are subject to change at any time without prior notice. The information contained in the commentaries is derived from sources deemed by Elm Wealth to be reliable, but its accuracy and completeness cannot be guaranteed. This material does not have regard to specific investment objectives, financial situation and the particular needs of any specific reader. Any views regarding future prospects may or may not be realized. Past performance is no guarantee of future results.
- Morningstar’s Active/Passive Barometer for U.S. Equity Funds and S&P’s SPIVA’s report of percent of large-cap U.S. equity funds beating the market both show much the same picture, though SPIVA compares funds against indexes that carry no fees.
- The CBOE Implied Correlation Index (COR3M) measures the market’s forward-looking expectation of how closely stocks will move together. It compares the implied variance of the S&P 500 index with the cap-weighted implied variance of 50 of its largest components. The result is the single correlation that, if it held between every pair of those stocks, would produce the index’s implied volatility. In reality, correlations vary from pair to pair.
- Sharpe, W. (1991), “The Arithmetic of Active Management,” Financial Analysts Journal.
- Active investors include active investment managers and all other investors who are diverging from the market portfolio, including retail and institutional investors too.
- Bogle, J. (1999), Common Sense on Mutual Funds, Wiley.
- See Fama, E. and French, K. (2010), “Luck versus Skill in the Cross-Section of Mutual Fund Returns,” The Journal of Finance.
- We should say, “never past 50% by much,” as there is some randomness in the result depending on differences in AUM by different managers, and to the extent the aggregate portfolio of active managers does not exactly match the market portfolio. For instance, in 2009, SPIVA reported 52% of managers outperformed their indexes. The SPIVA metric counts active managers outperforming, not the percentage of active AUM outperforming.
- Buffa, A.M., Vayanos, D. and Woolley, P. (2022), “Asset Management Contracts and Equilibrium Prices,” Journal of Political Economy; and Vayanos, D. and Woolley, P. (2013), “An Institutional Theory of Momentum and Reversal,” The Review of Financial Studies.
- This assumes active managers in aggregate earn the index return before costs, and that their returns relative to the index are normally distributed around minus their total costs, with standard deviation equal to their tracking error.
- Haghani, V., Ragulin, V., Rosenbluth, J. and White, J. (2023), “The Risk Matters Hypothesis,” Journal of Investment Management.
 Previous


