


October 14, 2026
Featured Insights
TIPS: Safer Than They Seem

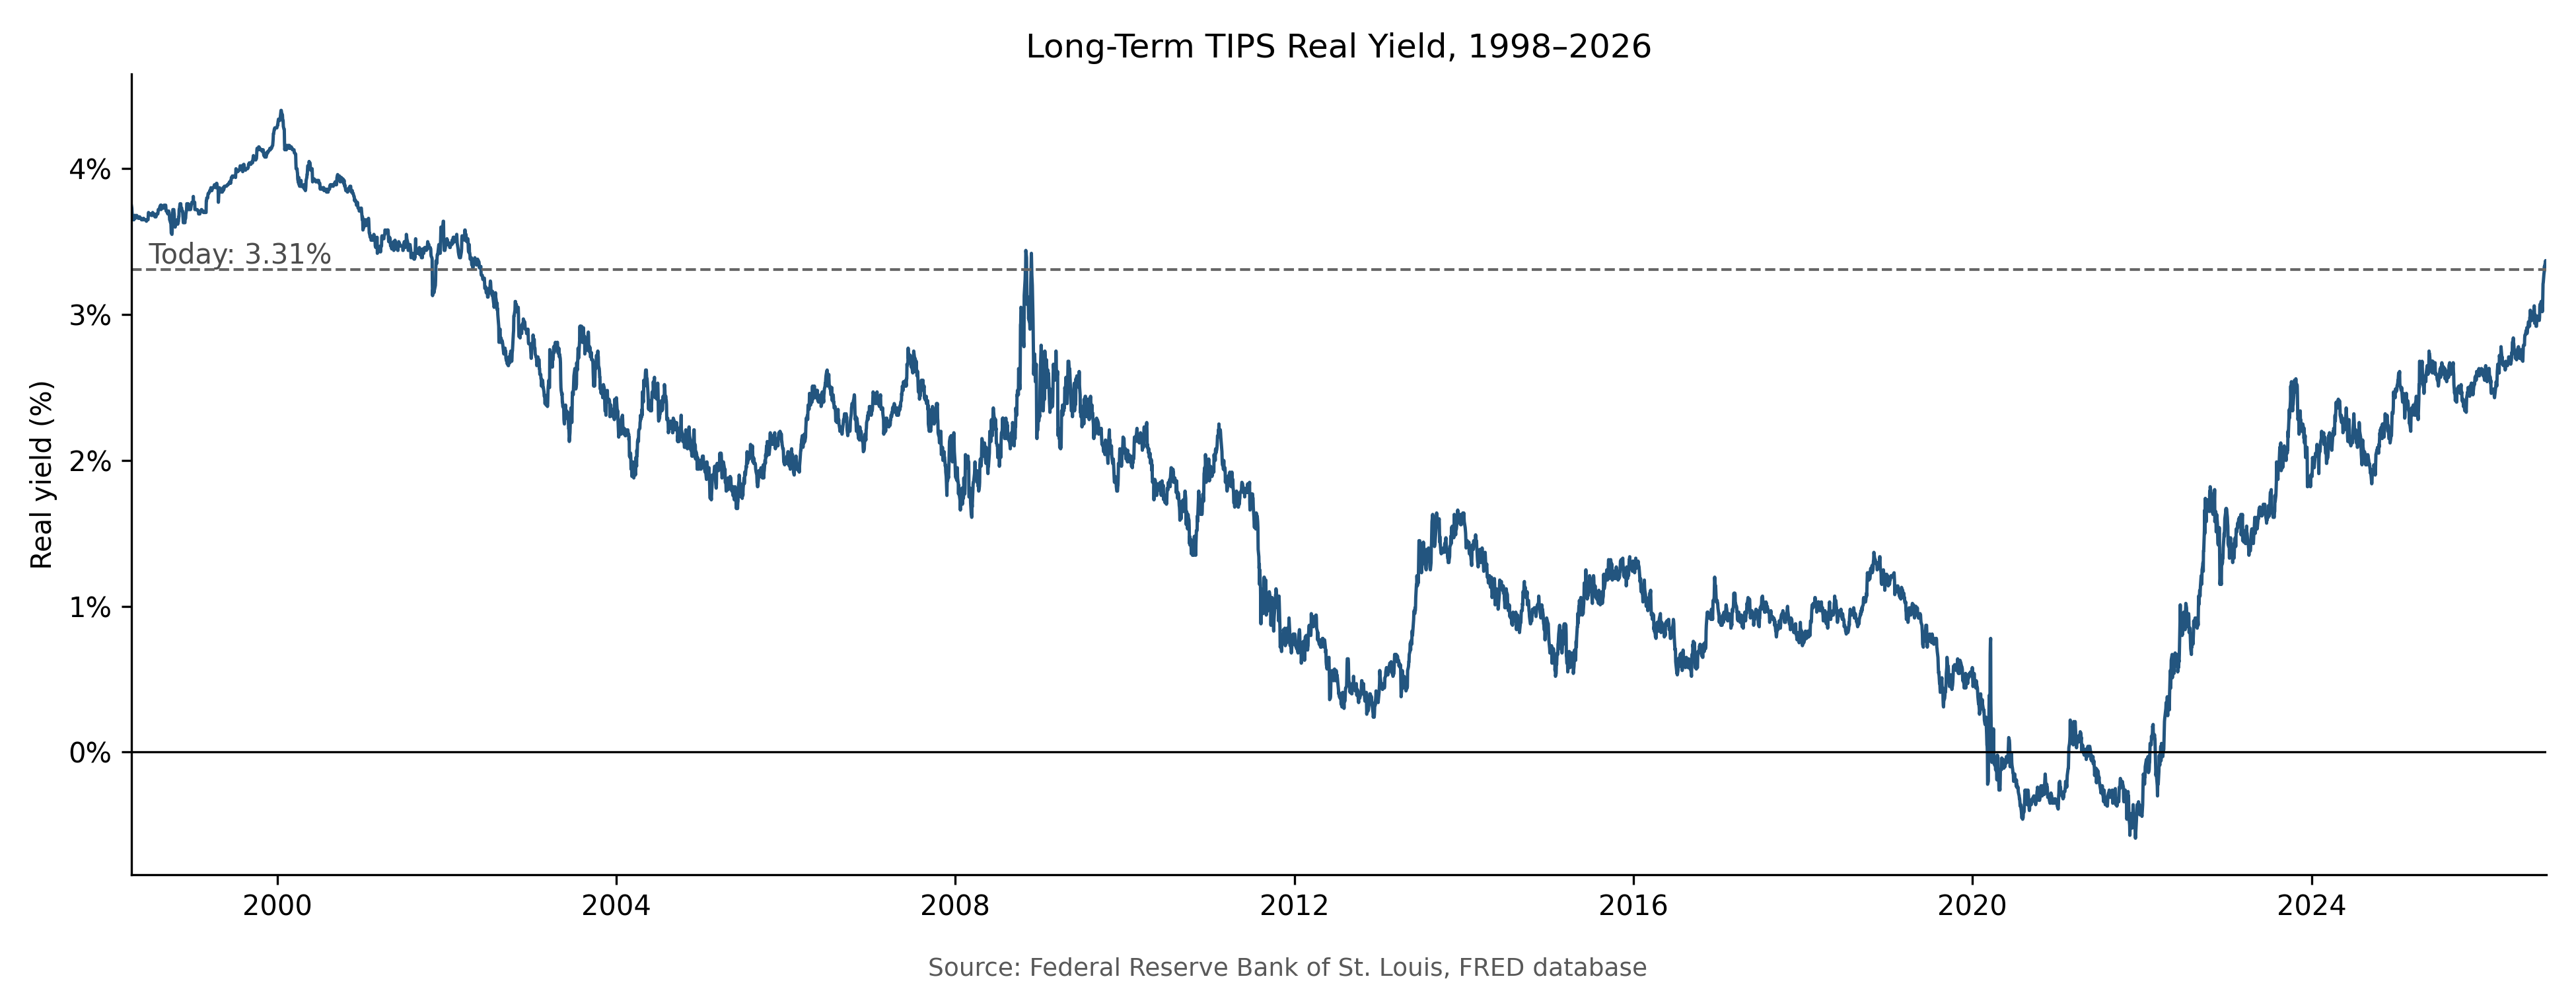
Treasury Inflation-Protected Securities (TIPS) are offering a yield to maturity of 3.3% plus CPI inflation for 30 years. Just over five years ago, they offered a negative real yield. How times have changed! Since 30-year TIPS were first issued in 1998, long-term real yields have been consistently higher only in their infancy from 1998–2002. Perhaps most notable of all, a 3.3% real yield is higher than the average risk-adjusted expected real return offered by a 60/40 stock/bond portfolio over the past 30 years.1
The Case Against TIPS
Yet many observers find TIPS unattractive, both in general and today. A recent FT article about TIPS, headlined “Not as safe as they seem,” is a good example. Their argument goes like this: when inflation comes in higher than expected, the Federal Reserve may raise interest rates to fight it, pushing up real yields. When real yields rise, TIPS prices fall. In other words, TIPS can lose value precisely when inflation rises, the very thing they’re supposed to protect you against. That doesn’t sound like much of an inflation hedge, at least from a trading perspective.
But is it the right way for individual investors to look at things?
Measuring Wealth as a Flow
In this article, we hope to clear up the confusion with one simple proposition: your wealth should be measured not by the value of your assets today, but by your lifetime real spending power. Thinking about wealth in this way was very common historically, and we dig into the reasoning behind it in our note Back to the Future: Reviving a 19th Century Perspective on Financial Wellbeing. This shift in perspective can be implemented by assuming a 50-year horizon and measuring your wealth by the annual spending it can support through a real2 annuity over that time period.
Thirty Years of Experience
Let’s see how your wealth, measured this way, would have changed over the past 30 years depending on which US government security you owned: Treasury bills (T-bills), 30-year nominal Treasury bonds, or 30-year TIPS.3 Although a 30-year bond doesn’t perfectly match our assumed 50-year spending horizon, it still provides a useful comparison. The chart below shows annual changes in annuity-equivalent wealth for each of the three asset types. TIPS were by far the least risky. Nominal bonds were more than twice as risky, and T-bills, which have nearly no market-value volatility, were five times as risky.
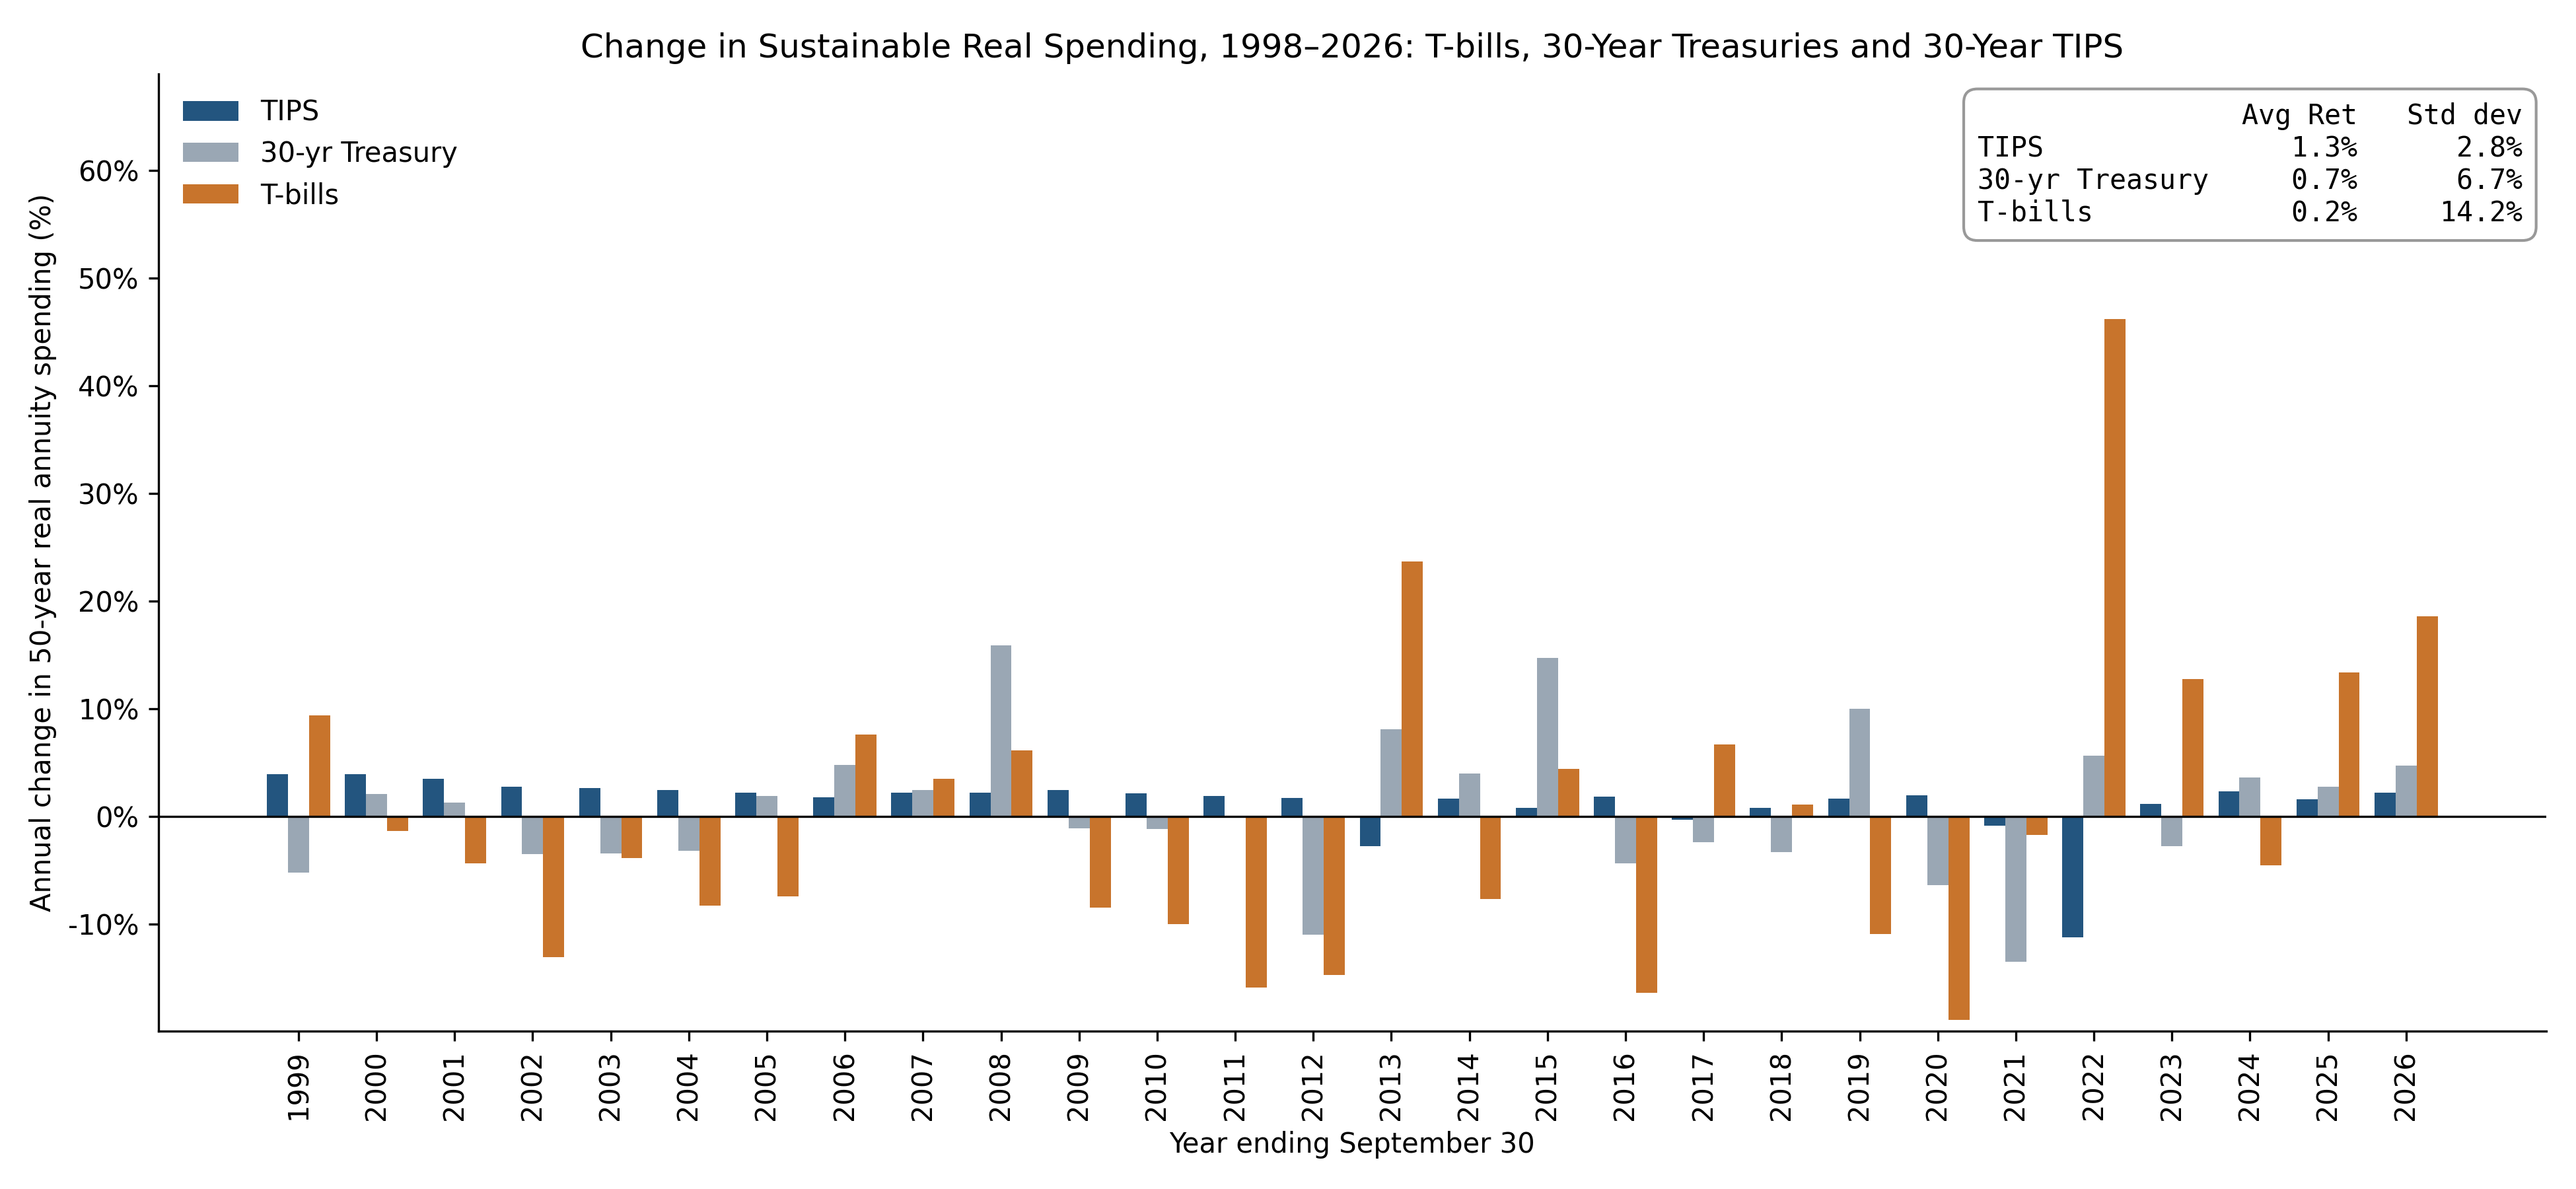
This illustrates an important point: while the inflation-adjusted market price of long-term TIPS can fluctuate significantly, they’re remarkably stable when measured using what really matters: the long-term spending they can support.4
The chart also shows your average annual return from each investment, again measured as the change in how much annuitized spending your wealth could support. Over the full period, TIPS did somewhat better than nominal bonds, and TIPS did much better than T-bills.5 We’re not suggesting you base an investing decision on this history, since past returns are not indicative of future returns. But we do think this clearly demonstrates how Treasury bills and long-term nominal Treasury bonds are risky investments, and in particular are much riskier than TIPS. Thus you should only own T-bills or nominal bonds if you specifically expect them to outperform TIPS.
TIPS vs T-Bills
For T-bills to replace TIPS in your portfolio, you have to expect their average real rate to exceed the real yield on long-term TIPS, and by quite a bit to justify the risk differential.6 Sometimes that might be a reasonable bet, as in late 2021, when the 30-year TIPS yield touched -0.5%. It might then have been plausible to expect T-bills to average, say, 1% above inflation over the long run. Even so it wasn’t a slam dunk, since T-bills had just delivered 2.5% below inflation from 2019 to 2021.
Today, the comparison looks very different. T-bills yield about 4.25%, and inflation over the next year is expected to be around 2.75%, implying a real yield of roughly 1.5%. Just to match TIPS returns, you’d need to expect the Fed to maintain short-term interest rates about 3.5% above inflation, on average, for decades. That seems like a stretch, and is contrary to history. If you expect T-bills to earn less than CPI + 3.5% over the long run, TIPS look more attractive, and considerably more so when bringing risk into consideration.
TIPS vs Nominal Bonds
The same type of reasoning applies to nominal bonds. They beat TIPS only if inflation averages less than the breakeven inflation rate, the gap between the yields on nominal bond and TIPS. Today, that breakeven is about 2.35%, below the 2.75% inflation expectation for the coming year and most long-term expectations as well. And since nominal bonds expose you to inflation risk, they should price in a higher inflation rate compared to expected inflation. TIPS bought at issue also guarantee that you’ll get back at least their original principal at maturity, even after a stretch of deflation, removing the one scenario in which nominal bonds clearly win. At current yields, we see little reason to own nominal bonds at all.
If you don’t have a strong view about the relative value metrics above, as many readers may not, TIPS are the best default fixed income choice for long term savings.
Liquidity, Credit Risk and Taxes
Critics point to TIPS’ liquidity. Indeed the TIPS market is smaller and thinner than the market for nominal Treasuries, and bid-ask spreads widen in a crisis, which matters if you’re forced to sell at the wrong moment. That’s a real cost, but a modest one. The TIPS market is roughly $2 trillion in size, and individual investors can easily access it through low-cost ETFs, as we do in Elm client portfolios and our ETF.
Sadly, US Treasury obligations aren’t completely free of credit risk, though market prices put the probability of default fairly low. In comparing TIPS and nominal Treasury bonds with T-bills, some adjustment should be made for the greater credit risk of longer-term bonds. Even after that adjustment, we think T-bills still look considerably worse than TIPS.
Finally, there are taxes. For US investors holding TIPS in taxable accounts, the annual inflation adjustment to principal is taxed as income, even though that adjustment isn’t received in cash until the bond matures or is sold. Higher inflation can therefore mean higher taxes.7 T-bills face a similar problem because their interest rates tend to rise with inflation. The simplest solution is to hold TIPS in a tax-deferred account, such as a 401(k) or IRA.8
None of these considerations, in our view, materially changes the relative attractiveness of TIPS, nominal Treasury bonds, and T-bills at today’s yields.
Could the CPI Be Fudged?
Some market participants worry that the current US administration would like to see the CPI calculation changed to show lower inflation. Those worries may be part of the reason long-term TIPS are offering such an attractive yield. Alas, we haven’t found a prediction market that indicates the consensus view of this happening, but perhaps one is in the works.9
The CPI calculation has evolved over time and not always without controversy or suggestions of political bias. But we suspect the risk of a direct, politically forced rewrite of the CPI calculation is low, given the legal safeguards, institutional resistance from non-political staff, and the potential cost of undermining global confidence in US financial markets.
Connecting the Dots
Every assessment of investment risk involves a choice of benchmark, and it’s easy to forget we’re making one. The convention is to measure risk in today’s dollars. That’s convenient, but for long-term personal investing it can be misleading. Your wealth is better measured by the inflation-adjusted spending it can support, for the rest of your days, and possibly beyond.
A boat tied to a floating dock rises and falls with every tide. If you measure it against the seabed it never stops moving, but measure it against the dock, where you’ll step aboard, and it barely moves at all. Long-term TIPS are like that boat: volatile in today’s dollars, but remarkably steady measured against the real spending they’ll support.
Seen this way, most of the confusion about TIPS disappears. They do exactly what they were designed to do. And as the safest asset going, their real yield is the natural benchmark against which to judge the stock market’s expected real return when you decide how much to invest in stocks.
Further Elm reading on TIPS and related topics
- Back to the Future
- A Sheep in Wolf’s Clothing
- Decoding the Bond Market
- Chapter 15 of The Missing Billionaires: A Guide to Better Financial Decisions
The content on this page is being provided as general market commentary and for educational purposes only. It does not constitute any form of investment advice, or recommendation to buy or sell any securities or adopt any investment strategy mentioned herein. Any investment strategies and investment results discussed herein are for illustration purposes only in the context of the commentary, and do not reflect actual or hypothetical Elm Wealth strategies or results, or an offer to provide such strategies or results.
This content is intended only to provide observations and views of the author(s) at the time of writing, both of which are subject to change at any time without prior notice. The information contained in the commentaries is derived from sources deemed by Elm Wealth to be reliable, but its accuracy and completeness cannot be guaranteed. This material does not have regard to specific investment objectives, financial situation and the particular needs of any specific reader. Any views regarding future prospects may or may not be realized. Past performance is no guarantee of future results.
- Using Payout-and-Cyclically-Adjusted Earnings Yield as the expected real return of the stock market. For an investor for whom such an asset allocation would have been optimal over time or on average.
- i.e. inflation-adjusted
- We’ve used a roughly 30-year historical window because 30-year TIPS were first issued in April 1998. During the period that new 30-year TIPS were not being issued, we used the yield on the longest maturity bond available.
- The 2022 data point is an exceptional illustration of how 30-year TIPS are an imperfect hedge for 50 years of spending. When real yields are near zero, as they were then, a 30-year TIPS behaves almost like a 30-year zero-coupon bond and is more sensitive to real rates than 50 years of level spending. When real yields jumped from about zero to 1.7% in the year to September 2022, the bond lost more than the annuity it was hedging.
- Why only 1.3% a year, when real yields started near 3.7% and ended near 3.3%? Each year we buy a new 30-year TIPS at that year’s yield, and the return in annuity terms roughly equals the yield earned that year. Real yields averaged 1.8% over the period and were near zero from 2010 to 2021, and the 2022 mismatch cost the rest.
- There are some subtleties here, which we discuss in our article “Decoding the Bond Market,” but they’re small enough to ignore here.
- UK investors, by contrast, aren’t taxed on the inflation uplift to the principal of UK inflation-linked gilts, known as “linkers.” Lucky Brits, at least in this one regard.
- A more complicated solution in taxable accounts is to run an inflation hedge using derivatives alongside your TIPS holding – not easy to implement for most investors.
- It would be a devilishly difficult contract to specify. And its price wouldn’t be a pure indication of the probability, as it might also contain a risk premium.
 Previous


