June 20, 2022
Investment Theory
Night Moves: Is the Overnight Drift the Grandmother of All Market Anomalies?
By Victor Haghani, Vladimir Ragulin and Richard Dewey1
This article is also available for download in PDF form on SSRN.
When we first heard about the overnight effect – the propensity for stocks to deliver all their returns when the market is closed and no returns during the trading day – our first reaction was: that can’t be right! After some preliminary reading, our follow-on reaction was: who cares!? In talking with market participants and academics, we found that most people shared our reaction, if they knew about the effect at all. “Bad data,” “quack analysis,” “a statistical fluke” were the common refrains.
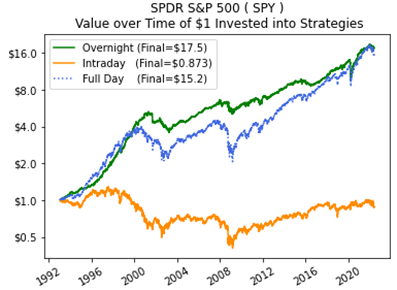
But after some more digging, we found plenty of evidence for the overnight effect and more vexing features to the puzzle. We found that not only did the effect exist at the index level as previously reported (see chart of S&P 500 returns below), but it also shows up in a suggestively clustered pattern in individual stocks returns, and is particularly strong in “Meme” stocks. Moreover, there are plenty of reasons to care about this market anomaly.
We think this research is important for three reasons. First and foremost is that retail traders are potentially missing out on billions of dollars of returns due to mistimed trades. Second, there is speculation that the overnight effect might have implications for the long-term valuation of the entire equity market. And finally, assuming our findings and those of others who have studied the effect are correct, this is one of the most consistent, significant and overlooked anomalies in finance, which can contribute to our understanding of the limits of market efficiency.
Hiding in Plain Sight
The “overnight effect” is observed across most major equity markets and is consistent back to the 1990s at least. And yet, just a smattering of papers over the years have explored this phenomenon – a tiny fraction of the attention devoted to other potential market anomalies such as momentum, value, or a host of other return factors – leaving the overnight effect an overlooked and largely unexplained anomaly in financial markets research.
Much of the search for an explanation for the overnight-versus-intraday effect in the broad stock market has focused on aggregate characteristics of the market, such as whether the level and nature of overnight risk compared to intraday risk warrants a higher overnight return. In search of clues to the underlying causes of the superior performance of the stock market overnight, we examined the behavior of individual stocks in the intraday versus overnight sessions.
Our primary line of research was to explore the return pattern of a long-short portfolio constructed to test for persistence in overnight-versus-intraday return patterns at the individual stock level.2 The portfolio generated a return of about 38% per annum (exclusive of estimated transaction costs and without leverage3), with a Sharpe Ratio high enough to make an efficient-markets economist blush. The reason we report the return excluding transactions costs is to emphasize that the purpose of this note is to understand why the stock market has delivered almost all its return when the lights are out, rather than to propose a potentially profitable trading strategy. Yes, a 38% return is very special and later in the paper we show how an investor could have made a modest amount of money from this anomaly. However, to have made a lot of money, an investor would have needed to think hard about employing leverage, improving the signal to noise ratio further, reducing risk through diversification and achieving low transactions costs (including market impact).
Background
The divergence between overnight and intraday returns of the aggregate stock market was first reported in 1986 by Ken French and Richard Roll. We found valuable insights in about a dozen academic papers thereafter, namely Cliff et al. (2008), Barardehi et al. (2021 and 2022), Berkman et al. (2012), Bogousslavsky (2021), Bondarenko (2020), Branch and Ma (2012), Hendershott et al. (2020), Kelly and Clark (2011), Lachance (2015, 2021), Lou et al. (2019), and Boyarchenko et al.(2020) of the NY Federal Reserve.
Perhaps the most widely discussed research on this puzzle is the half-dozen notes published on SSRN by Bruce Knuteson, a particle physicist and former employee of the pioneering quantitative investment firm, DE Shaw. Knuteson brings attention to Lachance’s (2015) finding that this return pattern was present in nearly every other stock market around the world.4 Notably, Knuteson has called on regulators and journalists to investigate the cause, which he argues will be found to be large quant funds pushing stock prices in favor of their existing leveraged long-short portfolios.
Hard to Explain
Potential explanations for the relatively high overnight return of the stock market include:
- Markets are riskier closed than open. For example, many economic indicators, earnings reports and merger announcements are released when the stock market is closed.
- Net of trading costs, including balance sheet, risk charges and funding costs for holding positions overnight, the anomaly goes away. If we think about the stock index as a risk-free bond, then we’d expect all the return to come overnight, when interest would be credited, with no return earned during the day.
- There are so many possible weird price patterns that we might observe, including many calendar-related ones that disappeared shortly after being “discovered,” that when we find one, we shouldn’t be surprised.5 It’s like bumping into a high school friend on a visit to Paris, and mistakenly concluding such a coincidence was one in a billion, without acknowledging that there are about a billion things that could happen every day that we’d find equally weird.
These sound plausible, but there is evidence in our research and others that #1 is empirically wide of the mark,6 and #2 explains some (note that the average T-bill rate was 2.4% over the period) but far from all of the overnight return, and does not explain why there was no return during the risky intraday session. Finally, the persistence of the effect, although weakened over the fifteen years since it was first reported, weighs against #3.
The Grandmother of All Anomalies?
Inspired by the research of Lachance (2015), we constructed a portfolio that was long, but only during the period the market was closed, the 20% of S&P 500 stocks7 that had the highest overnight-minus-intraday return over the prior two years,8 and short, again, only during the time the market was closed, the bottom 20% of stocks by that measure. The stock positions were equally weighted.
The chart below shows the growth of $1 invested in the long-short portfolio since 1995. The gross return is 38% per annum, exclusive of transactions costs. To get to a net-of-transactions cost figure, note that round-trip transactions costs of 1 basis point on each of the long and short side of the portfolio reduce returns by about 5% per annum, and a 1% borrow fee on shorts reduces the portfolio return by 1%.
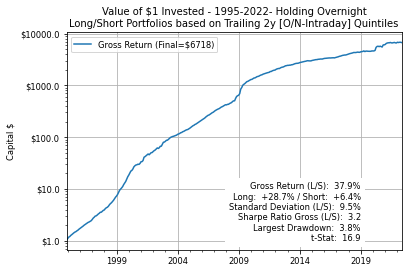
We find these results striking, and thought-provoking. How ever much one sees the overnight-versus-intraday returns of the S&P 500 to be anomalous and an affront to efficient markets theory, the effect observed at the individual stock level is significantly less likely to have been generated from the standard random walks associated with the Efficient Markets Hypothesis.9 Efficient markets champion Eugene Fama famously referred to the Momentum effect in individual stocks as “The Mother of All Anomalies.” Given the Sharpe Ratio of this long-short overnight strategy is about ten times higher than that generated historically by long-short momentum portfolios,10 perhaps this overnight long-short phenomenon should be known as the “Grandmother of All Anomalies”?
A Clue from Meme Stocks?11
If we can understand what’s behind the return of this long-short portfolio, perhaps it will lead to an explanation for the overnight-versus-intraday long only performance of the stock market at the index level. We believe the return patterns of the following Meme stocks provide a valuable clue:
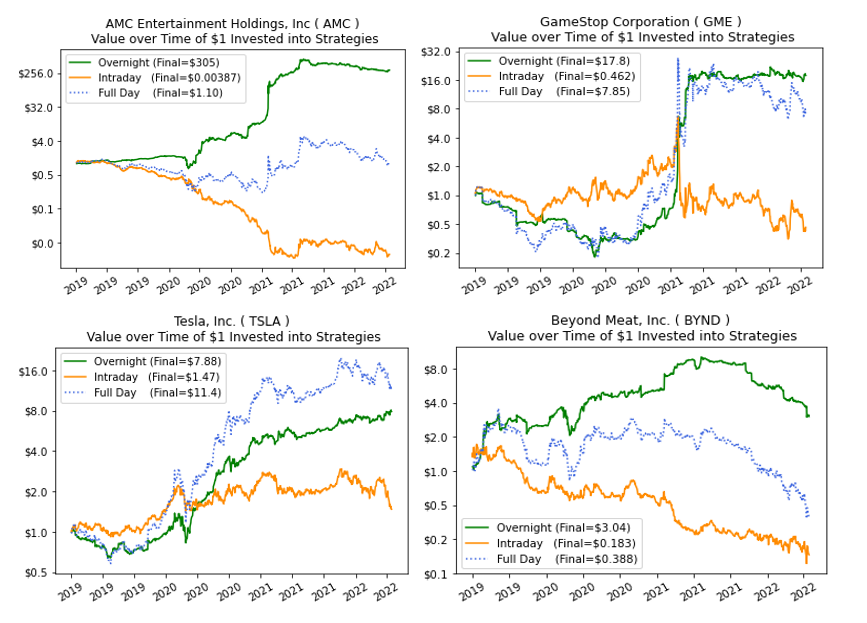
The first chart is saying that a day-trader who bought AMC Entertainment at the open and sold it at the close every day from the start of 2019 to late May 2022 would have suffered a 99.6% loss of capital – but, during the night, would have made a return of 30,000% over the same period (both ignoring transaction costs).12
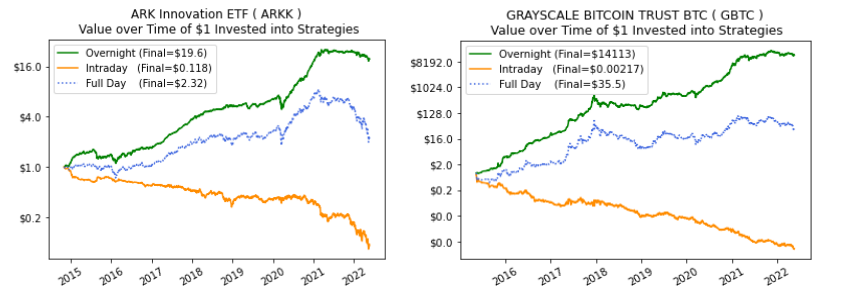
Could it be that the more an investment appeals to retail investors, the more it shows a better overnight return relative to its intraday return? A look at two investments – which are not stocks, but have strong appeal to retail investors – gives further weight to this idea. They are the ARK Innovation ETF (ARKK) run by Cathie Wood, and the Grayscale Bitcoin Trust (GBTC) which gives retail investors exposure to Bitcoin. The divergence between their overnight returns and their intraday returns is remarkable.
Attention Stocks
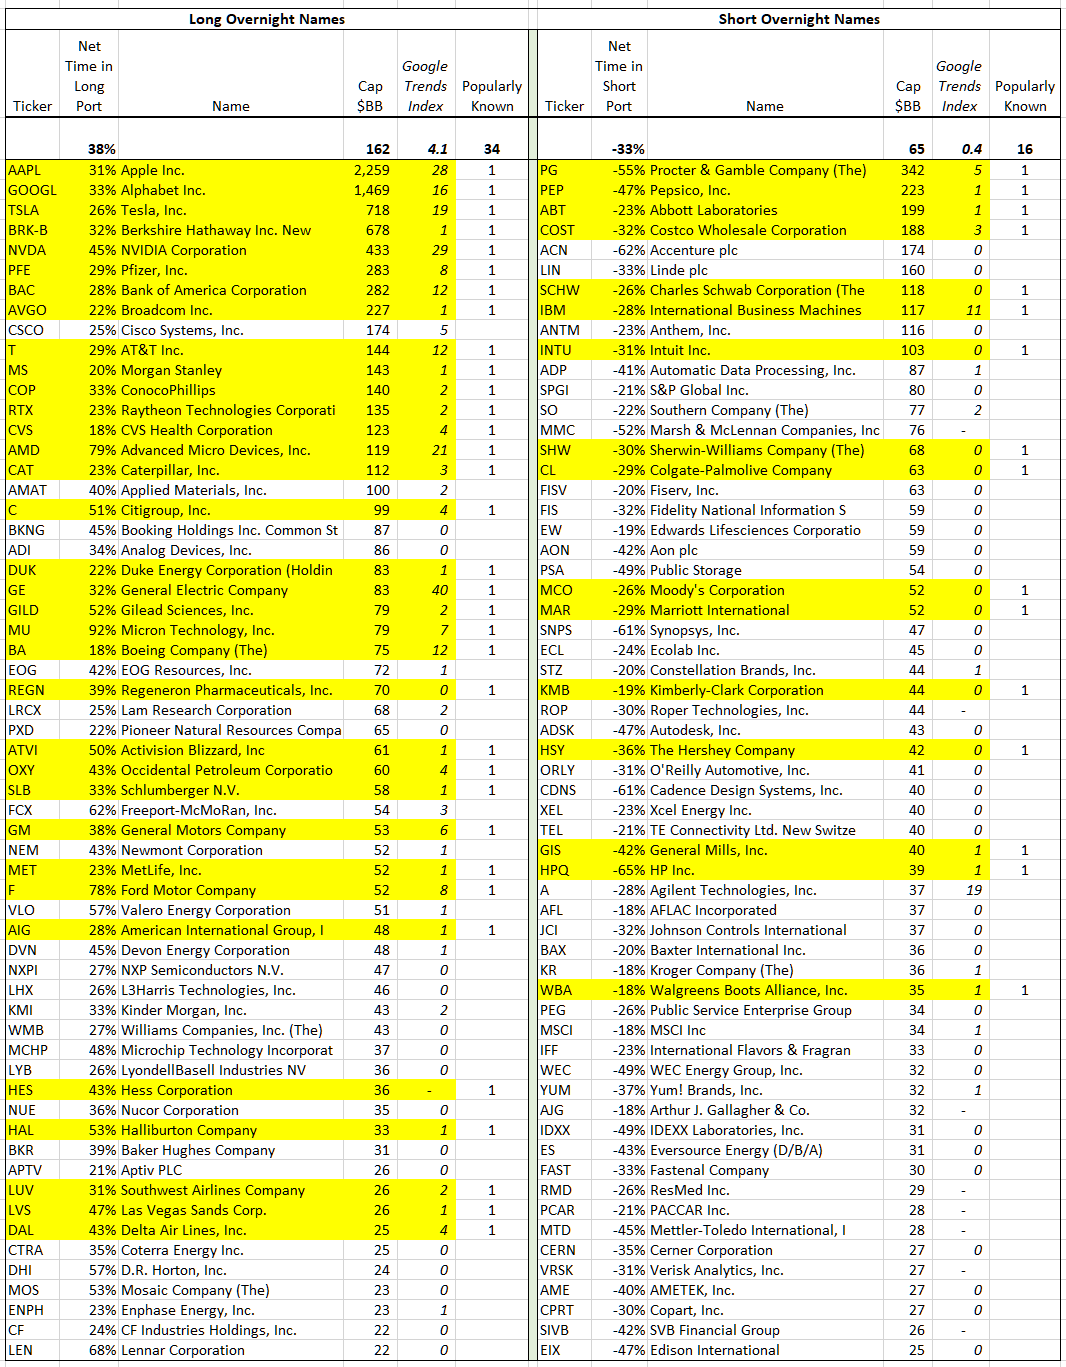
A striking feature of the stocks that tended to perform best at night was their popularity with retail investors, in that they were well-known brand names, frequently mentioned in the news (as quantified by Google Trends data), heavily traded in the options markets, and/or had high recent returns. Such stocks are aptly referred to as “Attention Stocks”, e.g. in Barber and Odean (2008) and Berkman et al. (2012). The table below shows the top sixty out of one hundred stocks by market capitalization that the strategy was on average net long or net short most frequently.13 We have highlighted in yellow the stocks that we think fit the Attention Stock definition best, and also show the Google Trends score. Notice there are twice as many Attention Stocks among the long overnight names as among the short overnight names, their Google Trend average score is about ten times higher, and the long overnight names are on average two and a half times larger in market capitalization than the short overnight names.14 This is consistent with results by Lou et al. (2014), Bogousslavsky (2021), and Barardehi (2022) who correlated overnight performance with popular style factors and found 15 that good overnight performers tend to have higher Price/Book ratios, higher Beta and volatility, lower quality of earnings, and higher momentum. Most of these characteristics fit an a priori notion of what retail investors would be attracted to, and are also just the characteristics that would raise some concerns with traditional real-money institutions who would otherwise have the capacity to hold these stocks overnight.
Connecting the Dots
In our view, an explanation based on retail investors pushing up opening prices seems the most plausible, as in Berkman et al. (2012). The specific mechanism that might be causing these return patterns is suggested by the following two generally accepted characteristics of market micro-structure:
- Stock market liquidity is deeper at the close of the trading day, and shallower at the open. A given size trade executed at the open has a bigger price impact than at the close.
- Retail investors place their orders more at the open, and institutional investors more at the close. This is seen from studies of brokerage trading records and analysis of the timing of small and large trades over the course of the day. Small trade sizes occur more towards the beginning of the day, and large trades later in the day.16 It seems reasonable that retail investors tend to make their single stock investment selections at leisure in the evenings or over the weekends, and then place their orders before going to work, which will often be executed at the open. When selling one stock to buy another, they may do that at the open too, but they may be more price sensitive and use limit orders to sell stocks out of their portfolios. In the 1990s, before the rise of online brokers, trading on the open was standard advice for retail traders as a way to avoid the bid/ask spread and ensure a reasonable execution at a price that can be checked against the Wall Street Journal. Conversely, institutions and/or professional money managers tend to like to execute at market closing prices, where there is more liquidity and also as they tend to have their performance judged against market closing prices.
The liquidity differential over the course of the day means this retail buying at the open hurts intraday returns, and helps overnight returns, while selling at the open has the opposite impact.17 The two critical links between retail impact at the open and the positive overnight drift in the broad market index are:
- The Attention stocks that comprise the long side of the portfolio returned 29% versus only 6% for the stocks on the short side of the portfolio. This asymmetry seems plausible, by which the force of attraction to Attention stocks is stronger than the more diffuse force of retail being repulsed by the “anti-Attention” or “Neglected” stocks, which make up the short side of the portfolio.
- The Attention stocks that make up the long side of the portfolio have larger market capitalizations than the Neglected stocks on the short side, and so the impact of a given percentage increase in price in those long stocks would outweigh an opposite percentage price impact on the short stocks for a market capitalization weighted index, like the S&P 500. So, even if the force of retail’s attraction to Attention stocks were equal to the force of repulsion from Neglected stocks, we should still see a net upward drift in the overall broad stock market index.
The proposition that retail investors think about what trades they want to do when the market is closed and then put in orders on the open is supported by noting that average returns to the long-short portfolio over weekends were about one and a half times higher than returns between weekdays.18 It seems that retail investors have spent some of the extra time afforded by the weekends to read Barron’s and think about what trades they want to do when the markets open again – although given the ratio of the size of the effect is not quite proportional with the extra free time, it’s comforting to know that retail investors also spend some of their weekends playing golf and watching Netflix!
Weekends also present a natural experiment testing the alternative hypothesis that the overnight effect was caused by companies on average announcing better-than-expected earnings after trading hours over the past thirty years. Since US companies release earnings much less frequently just before weekends and holidays, the fact that weekends exhibited more overnight drift discounts this earnings-driven explanation.
Any explanation should also account for similar divergences between overnight and intraday returns that have been witnessed in other assets, particularly when packaged in ETFs. For example, Vanguard’s popular broad bond market ETF, BND, and Invesco’s Commodity Index tracker, DBC, have had a higher return overnight than over the full day over the past 15 years. Perhaps this is explained by observing that in some sense ETFs are like popular stocks, since they are mostly retail-oriented with market-makers providing liquidity. A more detailed explanation is provided by Lachance (2021) “ETFs’ High Overnight Returns: The Early Liquidity Provider Gets the Worm” in which she argues:
“At the root of this distortion [of unusually high ETF overnight returns] is the phenomenal growth of the ETF market, which the paper shows is associated with highly positive order imbalances [at the market open] that exceed 10% on average. As the saying goes, ‘The early bird gets the worm’ and this paper shows that it can be particularly rewarding to provide liquidity around the open as the spreads are three to four times higher than during the day.”
Kelly and Clark (2011) suggest that the overnight effect arises from day-traders who are averse to taking overnight risk and therefore liquidate their portfolios at the close and reestablish them in the morning. Similarly, high frequency market makers may choose to avoid holding overnight risk even if it means sacrificing some expected return to flatten their books at the close of trading.
This Attention Stock story does not mean other explanations (e.g. Lou et al.’s, Kelly and Clark’s, Knuteson’s, Mamayski’s, and others) cannot also provide part of the answer, perhaps even a bigger part, but we do believe that our explanation likely provides one important piece of the puzzle.
Of course, there is a more prosaic explanation for the observed overnight-versus-intraday behavior, which would be that the opening and closing prices which we, and other researchers, have used in this area of study are simply not reflective of actual prices available to market participants.
The $100 Bill That Shouldn’t Be There
It’s not enough to describe the potential cause of the overnight phenomena; we also must explain why sophisticated capital hasn’t traded against it in sufficient size to make it go away.
The most common and reasonable explanation is transaction costs, with particular emphasis on market impact. Trading at the opening and closing auctions does not involve crossing a bid-ask spread. However, price impact – the amount a trade moves the market – will be a meaningful consideration for an investor contemplating dedicating significant capital to taking the other side of this anomaly. Brokmann et al. (2014) and Frazzini et al. (2018) estimate transaction costs including price impact for large traders and generally agree with the “square root of fraction of volume” function put forward by Kyle (1985) and Barra (1997). This function suggests that trading just 1% of daily volume of a stock that exhibits 2% daily price volatility would result in 40 basis points of round-trip price impact, which would reduce annual returns of a long-short overnight portfolio by 200% per annum.
Commissions and exchange fees might also have played a role. At the beginning of our sample, which starts in 1995, commissions were significantly higher. A 10 basis point per trade commission level, not uncommon in early 1990s, would have translated into a 100% per annum performance drag. And even a trader executing small sizes and paying only 1bps per trade would not have made any money in the last 8 years, even though the strategy’s gross returns remained very attractive.
Very sophisticated trading firms might be able to mitigate the above frictions. However there are several reasons why these firms might be reticent to trade the overnight effect. Some of the reasons include:
- Risk covariance: The overnight-versus-intraday drift may be one of a number of anomalies caused by retail flows, making it a less attractive opportunity as part of a portfolio that already has a lot of exposure to strong retail flows. For example, we note that during the period in early 2020 when there was a reversal in the direction of the overnight-versus-intraday effect at the index level, some prominent quant funds (including DE Shaw) suffered significant losses.
- Size constraint: There may be a limit on the size of trade informed capital can do in the opening auction, which may be a constraint if the number of players able to take the other side of retail is limited.
- Risk tolerance: HFT and other market makers exhibit a strong preference to end the day with flat positions. They like to be able to manage their exposure minute to minute, and are averse to being locked in for hours or days (i.e. weekends and holidays). Similarly, mid-frequency statistical arbitrage firms like to end the day without significant factor exposures and are willing to pay to close positions.
- Infrequent, but severe drawdowns: This is often cited as a possible explanation for cross-sectional Momentum returns in equities as described by Daniel et al. (2016). However, the long-short overnight individual stock strategy’s most severe drawdown was just 4%, so this explanation does not apply to historical returns of the strategy examined herein, although perhaps large drawdowns are latent.
Going, Going, Gone?
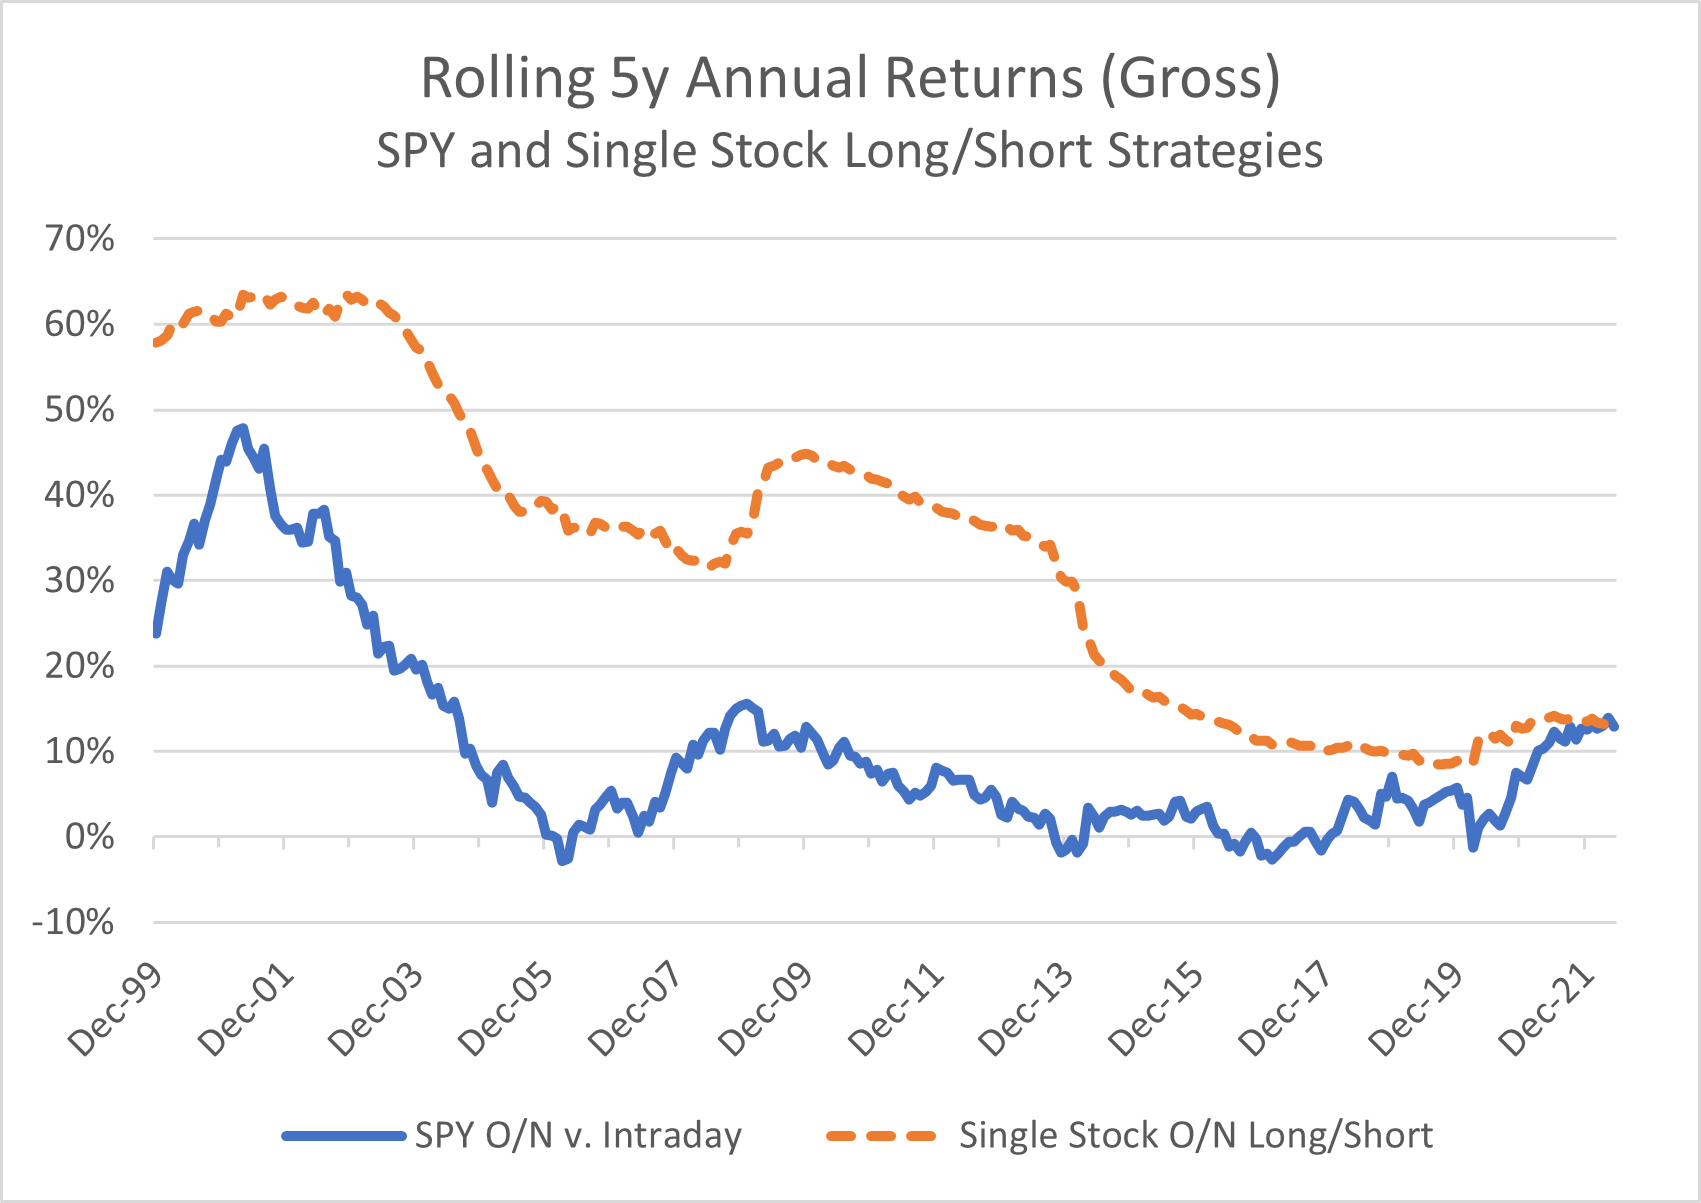
These “limits to arbitrage” arguments explain why a tsunami of capital has not washed the overnight-versus-intraday anomaly away. However, these limits are not enough to stop a decay of the inefficiency, and indeed we observe that the effect has been waning following the circulation of a half dozen relevant papers between 2008 and 2015. The chart below shows five-year rolling returns to the long-short portfolio, which suggests, but doesn’t quite prove, that something has changed in the past five to ten years. We also show the rolling five-year overnight minus intraday returns of the S&P 500, which shows the same general pattern of very high realized returns until about ten years ago. It is interesting that several ETFs are in the works which are structured to only invest in the stock market when it is closed.19
Macro Worries
Is it possible that the upward price impact at the open on Attention Stocks has had a cumulative impact of pushing the overall stock market to a higher level than would otherwise be the case? Even if our description of some of the market forces at play is valid, the answer depends on the speed of decay of price impact and the effectiveness of active investors to lean against non-fundamentally driven price changes. It is a topic which has already received attention, such as Shiller (1984), but perhaps in light of the overnight-versus-intraday behavior that we’ve discussed herein, it is a question worthy of further research. These overnight-versus-intraday patterns just don’t look like what we’d expect from a healthy, well-functioning market where all investors are getting a fair shake.
Putting the Overnight Effect to Bed… for Now
Our research on the overnight effect in single name stocks suggests that the hypothesis of retail trading likely goes a long way toward explaining the phenomenon at both the level of the overall stock market, and that of individual stocks. There is likely some additional interplay with other market participants, along with balance sheet, risk and funding charges that also account for some of the observed effect.
It’s plausible that well-known mid-frequency statistical arbitrage funds are indeed taking advantage of this effect as has been previously suggested, but due to transaction costs and portfolio construction constraints, they are unable to completely arbitrage the effect away. Without arbitrage players taking the other side of retail, the overnight effect might have been much larger than what we observed.
It has been suggested that ordinary investors should take heed of this phenomenon and execute their buys at the end of the day, and sales at the open. That advice is not wrong, but it’s worth bearing in mind that even for a relatively active investor who turns over 100% of their portfolio per year, the improvement in return they should expect is only a few basis points. And, for non-professional investors who are so actively trading that this would make a big difference, our suggestion would be to trade less rather than trade at the close!20
Sadly, it is possible that retail investors who actively trade individual stocks have left many billions of dollars of stock market return on the table. Of course, this is not a novel insight. For example, Barber and Odean’s seminal paper, “Trading is Hazardous to Your Wealth” (2000), found that households that traded the most at a large discount broker from 1991 to 1996 underperformed the market by 6.5% per year. A more recent survey of the retail stock trading scene in Spencer Jakab’s “The Revolution That Wasn’t: GameStop, Reddit, and the Fleecing of Small Investors,” (2022) vividly documents the herd behavior that likely generated the massive divergence between overnight and intraday returns in Meme stocks. Alas, it is a tale that does not have a happy ending.
We hope that our research on individual stocks goes a little way toward explaining this curious and puzzling phenomenon. While we can’t be sure of the exact drivers, we believe that the overnight effect merits further study given its potentially large implications for retail traders, policy makers, academics and ultimately all curious market denizens.
PS…
Perhaps the Bloomberg financial journalist and humorist Matt Levine is on to something when he suggests,
“…the stock market should have much, much shorter hours; 15 or 30 minutes a day should suffice for everyone who wants liquidity to find it, and traders could spend the rest of their days researching companies… or reading poetry or hanging out with their families…Go home! Read a book! Walk the dog!”
– Money Stuff, Feb 6th 2020 and Oct 6th 2021
And for retail investors, we might add: “And get better returns!”
Further Reading and References
- Barardehi, Y., D. Bernhardt, T. Ruchti, and M. Weidenmier. (2021). “The Night and Day of Amihud’s (2002) Liquidity Measure.” Review of Asset Pricing Studies.
- Barardehi, Y, V. Bogousslavsky, and D. Muravyev. (2022). “What Drives Momentum and Reversal? Evidence from Day and Night Signals.” Working Paper.
- Barber, B. and T. Odean. (2000). “Trading is Hazardous to Your Wealth: The Common Stock Investment Performance of Individual Investors.” The Journal of Finance.
- Barber, B. and T. Odean. (2008). “All That Glitters: The Effect of Attention and News on the Buying Behavior of Individual and Institutional Investors.” The Review of Financial Studies.
- Barra. (1997). “Market Impact Model Handbook.” MSCI.
- Berkman, H., PD Koch, L. Tuttle, and YJ Zhang. (2012). “Paying Attention: Overnight Returns and the Hidden Cost of Buying at the Open.” Journal of Financial and Quantitative Analysis.
- Bogousslavsky, V. (2021). “The Cross-Section of Intraday and Overnight Returns.” Journal of Financial Economics.
- Bondarenko, O. and D. Muravyev. (2020). “Market Return Around the Clock: A Puzzle.” SSRN.
- Boyarchenko, N, L. Larsen, and P. Whelan. (2020). “The Overnight Drift.” Federal Reserve Bank of New York.
- Branch, B. and A. Ma. (2012). “Overnight Return, The Invisible Hand Behind Intraday Returns?” Journal of Applied Finance.
- Brokmann, X., E. Serie, J. Kockelkoren and JP Bouchaud. (2014). “Slow Decay of Impact in Equity Markets,” ArXiv.
- Cliff, M., MJ Cooper and H. Gulen. (2008). “Return Differences between Trading and Non-Trading Hours: Like Night and Day.” Unpublished Working Paper, University of Utah.
- Daniel, K. and T. Moskowitz. (2016). “Momentum Crashes.” Journal of Financial Economics.
- Frazzini, A., R. Israel and T. Moskowitz. (2018). “Trading Costs.” SSRN.
- French, K. and R. Roll. (1986). “Stock Return Variances: The Arrival of Information and the Reaction of Traders.” Journal of Financial Economics.
- Hajric, Vildana and Lu Wang. (2022). “New ETFs Aim to Capture Those Overnight Returns in Stock Market.” Bloomberg.
- Hendershott, T., D. Livdan and D. Rosch. (2020). “Asset Pricing: A Tale of Night and Day.” Journal of Financial Economics.
- Jakab, Spencer. (2022). The Revolution That Wasn’t: GameStop, Reddit, and the Fleecing of Small Investors, Portfolio.
- Kelly, MA and Clark, SP. (2011). “Returns in Trading versus Non-Trading Hours: The Difference is Day and Night.” Journal of Asset Management.
- Knuteson, B. (2016). “Information, Impact, Ignorance, Illegality, Investing, and Inequality.” SSRN.
- Knuteson, B. (2018). “How to Increase Global Wealth Inequality for Fun and Profit.”SSRN.
- Knuteson, B. (2019). “Celebrating Three Decades of Worldwide Stock Market Manipulation.”SSRN.
- Knuteson, B. (2020). “Strikingly Suspicious Overnight and Intraday Returns.”SSRN.
- Knuteson, B. (2021). “They Chose to Not Tell You.”SSRN.
- Knuteson, B. (2022). “They Still Haven’t Told You.”SSRN.
- Kyle, A. S. (1985). “Continuous auctions and insider trading.” Econometrica.
- Lachance, Marie-Eve. (2021). “ETFs’ high overnight returns: The Early Liquidity Provider Gets the Worm.” Journal of Financial Markets.
- Lachance, Marie-Eve. (2015). “Night Trading: Lower Risk But Higher Returns?” SSRN.
- Levine, Matt. (2018). “Is Everything Manipulated.” Bloomberg.
- Lou, D., C. Polk and S. Skouras. (2019). “A Tug of War: Overnight Versus Intraday Expected Returns.” Journal of Financial Economics.
- Mamaysky, forthcoming.
- Qiao, K. and L. Dam. (2019). “The Overnight Return Puzzle and the ‘T+1’ Trading Rule in Chinese Stock Markets”. SSRN.
- Shiller, R. (1984). “Stock Prices and Social Dynamics.” Brookings Papers on Economic Activity.
- Victor is the founder and CIO of Elm Wealth, Vlad is a consultant with Elm and Rich is a co-founder of Raposa Research and an advisor to Royal Bridge Capital.
Thank you to Alexey Bachurin, Larry Bernstein, Simon Bowden, Samir Bouaoudia, Aneet Chachra, Adrian Eterovic, Ian Hall, Larry Hilibrand, Antti Ilmanen, Costas Kaplanis, Bruce Knuteson, Marie-Eve Lachance, Harry Mamaysky, Steve Mobbs, David Modest, Terrance Odean, Vladimir Pakhomov, James White, and Anna Wroblewska for taking a look and sharing their reactions, comments, and experiences with us.
This note is not an offer or solicitation to invest. Past returns are not indicative of future performance.
- All data in this note is from Yahoo Finance. For S&P 500 chart, includes reinvested dividends, and net of fees charged on the SPY ETF, but without trading costs. As an additional check, we re-ran the analysis using price data from another data vendor, eodhistoricaldata.com and using our own Elm index of US Liquid Equities instead of S&P 500 (to control for systematic patterns around S&P rebalances). The results were very similar. We are happy to make the Python code we used to collect the data and perform the calculations available.
- For $1mm of capital our simulated portfolio is long and short $1mm each.
- With the notable exception of China, which Qiao and Dam (2019) discuss in a way that Knuteson argues perfectly fits his thesis.
- Ignoring the selection bias aspect of the problem, just how unlikely an outcome is the observed overnight versus intraday return pattern? An intuitive perspective on the problem is to imagine putting all the intraday returns in an unbroken sequence. If intraday volatility was 70% of close-to-close volatility on average (in fact, it was a bit higher), then 30 years of intraday experience would be equivalent to 15 years of normal stock market volatility. Assume the same for the overnight as well.
Now we can think about the question like this: how weird is it to have had a 15-year period when the stock market had a roughly 0% return, followed by a 15-year period when it returned about 20% a year? Based on Professor Robert Shiller’s 150 years of US stock market data, that never occurred, as there was no 15-year period of a 20% annual total return. So, yes, the overnight versus intraday return of the S&P 500 is quite unexpected.
- While the standard deviation of overnight returns from 1993-2022 was lower than that of intraday returns, overnight returns exhibited greater negative skew and kurtosis (fat-tailedness). However, for an investor with typical risk-preferences, the lower standard deviation far outweighed the impact of the difference in the higher moments.
- That is, stocks that were in the index in May 2022. We also ran the analysis based on the largest stocks that were trading at each point in time, as detailed in footnote 2, and the results were essentially the same.
- The indicator we use is a simplified version of the Overnight Bias Parameter (OBP) used by Lachance, which had a two-year lookback window. This is only one of several factors that showed statistically significant ability to predict overnight excess return in her study.
We also examined performance using a window of six months, one year and three years, and qualitatively similar results, with the six month and one year windows generating somewhat more positive historical simulated performance.
- For example, the t-statistic for the long-short strategy is about 17 versus 2 to 3 for the overnight-versus-intraday effect in the S&P 500 depending on choice of the null hypothesis being tested.
- See Kenneth French data library here.
- From Wikipedia:“A Meme stock is a stock that gains popularity among retail investors through social media. The popularity of meme stocks is generally based on internet memes shared among traders, on platforms such as Reddit’s r/wallstreetbets. Investors in such stocks are often young and inexperienced investors. As a result of their popularity, meme stocks often trade at prices that are above their estimated value based on fundamental analysis, and are known for being extremely speculative and volatile.”
- Note that three of the four Meme stock examples above were not part of our long-short strategy, as they were not members of the S&P 500, although they did make appearances in our alternative dataset, described in footnote 2.
- For the Google Trends Index, we took the average of the top 60 names by time spent in long/short portfolios, which is more representative of our equal-weighted portfolio simulation. Taking top longs/shorts by market cap produces similar results.
- That the stocks in the overnight portfolio were bigger than those in the short overnight portfolio was the case for almost the entire period from 1995 – but, from around March 2020, the average size of the short portfolio became larger.
- See Table II Lou et al. (2019).
- See Figure 3 in Lou et al. (2014).
- It is also believed that retail traders overreact to news that arrives when the market is closed, but it is not clear how this would cause an upward drift in the long-short portfolio or the broad market.
- The standard deviation of returns of the long-short portfolio between weekdays and over weekends was roughly the same at about 0.5%
- See “New ETFs Aim to Capture Those Overnight Returns in Stock Market”, Bloomberg, March 4, 2022.
- This excludes professional quant funds who don’t need our advice. Their ability to make money from such weak and decayed signals is much greater due to super-low trading costs, cutting-edge techniques to separate alpha from noise, and ability to diversify on an industrial scale.