May 13, 2020
How Elm Works
Back to the Future: Reviving a 19th Century Perspective on Financial Well-Being
By Victor Haghani and James White 1
“Mr. Darcy soon drew the attention of the room by his fine, tall person, handsome features, noble mien, and the report which was in general circulation within five minutes after his entrance, of his having ten thousand a year.“
– Jane Austen, Pride and Prejudice (1813)
These days, we tend to assess our net worth by tallying up the market value of our financial assets, even though it might be more natural to think of our wealth as a stream of dollars over time given the nature of our income and spending. Perhaps this fixation on lump sum wealth is induced by the media – you won’t find Elon Musk on any rich list appraised at $1 billion per year, even though that’s about what his $40 billion of stock holdings would be worth in annuity form. But if you see your savings as a means to the end of future spending and bequests, the per-year measure seems more appropriate.
Let’s entertain the idea that what we really care about is the long-term, inflation-adjusted purchasing power which $1 can lock in today – we’ll call this the ‘Real Annuity Value’ of $1.2 This shift in perspective has some pretty big implications for how we save and invest. For one, we have to rethink the notion that T-bills and other cash proxies, such as money market funds and bank deposits, are the lowest-risk assets we can own. While it’s true that the nominal value of T-bills doesn’t go up or down much day to day, we’ll see them as dramatically more risky once we focus on their Real Annuity Value.
The chart below shows the ‘real’ (i.e. inflation-adjusted) total return history of T-Bills, in terms of both dollars and Real Annuity Value:
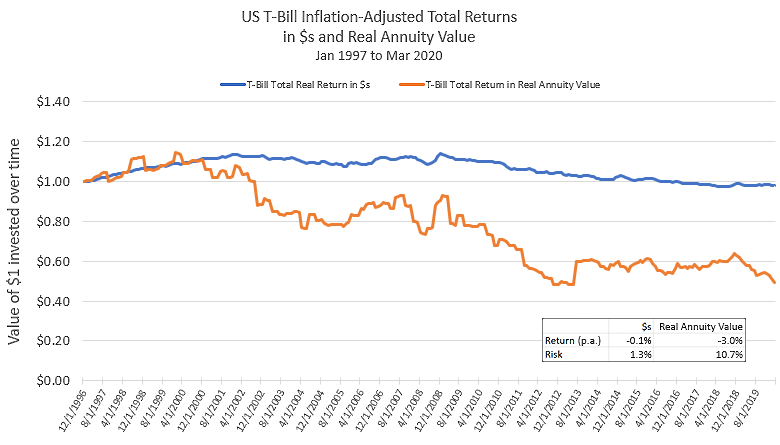
As you can see, in dollars T-Bills had very low risk as well as very low real total return. Not so when looking at their performance expressed in Real Annuity Value: if you were invested in T-Bills over the whole period, by the end you could only buy half the Real Annuity you could have bought at the beginning. That’s a really significant loss of long-term purchasing power for a supposedly low-risk investment. The much lower Real Annuity Value delivered by T-bills is not a result of inflation, which we’re accounting for. Instead, it’s because long-term real interest rates, which set the payout of real annuities, dropped from 3.75% in 1997 to about 0% today. Looking further back in time, investments in US T-bills lost about 33% and 40% respectively of their Real Annuity Value over 1916 – 1920 and 1940 – 1948.3
Now let’s do the same comparison for the S&P 500:
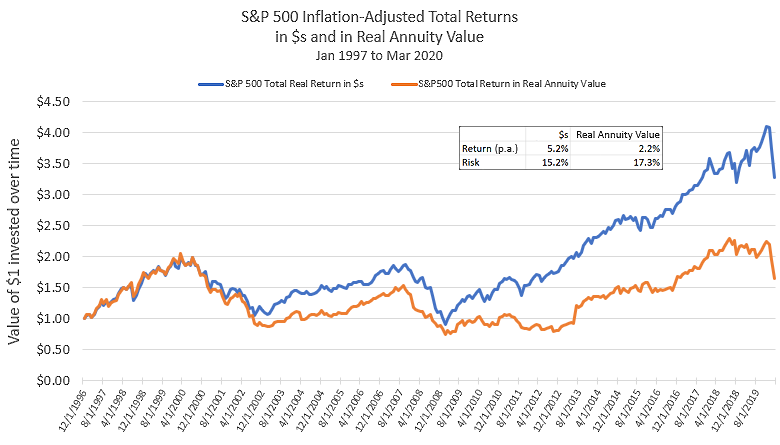
We see that, while the total returns differ, equities are about as equally volatile measured in dollars or in Real Annuity Value. T-Bills lost about 50% of their Real Annuity Value, while equities gained about 50% – respectable, though far less than their dollar gains of over 200%.
It’s easy to read too much into these charts over any given period, but one interpretation is that equities are intrinsically a bit like a real annuity themselves: they provide an indefinite stream of earnings, which naturally adjust somewhat to inflation. They’re risky and have a volatile risk premium relative to the Real Annuity Value, but nonetheless they’re more like a real annuity than T-Bills are.4
Conclusion:
“Our approach to saving is all wrong: We need to think about monthly income, not net worth.”
– Robert C. Merton, HBR (2014)
We’ve seen that T-Bills and similar cash-like assets are significantly more risky in terms of Real Annuity Value than they appear when viewed in plain dollars. Given their generally low expected real return, this makes cash-like assets look pretty unappealing to hold in excess of amounts needed to cover near-term expenses and contingencies. In contrast, equities are not significantly more risky in this new light, and may be even more attractive if we believe the long-term expected earnings streams they generate makes them a form of a long-term, real annuity. In our recent note Taking Stock, we found that the stock market currently looks more attractive viewed from the Real Annuity Value perspective, both prospectively and relative to historical valuations.
Back in Jane Austen’s day, wealth was harder to value and less liquid than it is today – one reason why it was more common to think about it as an annual flow, rather than an upfront value. While it’s more straightforward to measure your investment portfolio as a current lump sum value, a significant fraction of most peoples’ financial resources – their human capital and future social security and pension benefits – are much more readily thought of as long-term real annuities. If you see your wealth as a reservoir for long-term future consumption, we think it’s well worth the extra mental effort to think about all your financial resources and decisions with the Real Annuity Value perspective.
Appendix: Real Annuity Value Mechanics
Once we start measuring financial well-being in terms of long-term annual purchasing power, we’ll need to identify a new risk-free asset to take the place of T-bills.5 What we need is an asset that pays a real $1 per year for many years, and with the highest assurance of payment possible. US Government Treasury Inflation-Protected bonds (TIPS) are a pretty good candidate, even though their cash flows aren’t quite in the form of a long-term real annuity due to their principal repayment at maturity.
Improving upon TIPS as our risk-free asset to generate the historical return charts in this note, we constructed a new currency: the RA-$ (for Real Annuity Dollar) which represents $0.02 per year for the next 50 years, adjusted for inflation. The value of the RA-$ will fluctuate versus the regular Dollar, driven by long-term real interest rates, which we can get from the market pricing of TIPS. Since long-term real interest rates are about zero right now, the value of RA-$1 currently would be equal to about $1, as 2 cents per year, inflation-adjusted for 50 years equals $1 discounted at a zero real interest rate. In early 1997, at the start of the period in our chart, long-term real interest rates were about 3.75%, making the value of RA-$1 about $0.50 regular Dollars.
Prior to 1997 – when the US Treasury started issuing TIPS – the notion of Real Annuity Value and RA-$’s would have been purely hypothetical. Over the past twenty years, there have been many books and articles from experts in personal finance such as Robert Merton, Zvi Bodie and John Campbell that argue the Real Annuity Value framework is the most consistent and logical one for reaching sound personal financial decisions, and that investors should adopt TIPS as their minimum risk asset in lieu of T-bills and other cash-like investments. If investors were to embrace this shift in perspective more broadly, the long-term TIPS market would have to grow well beyond its current size of $215 billion, which is less than 1% of the total US Treasury and investment grade bond market.
Further Reading and References:
- Austen, Jane. Pride and Prejudice. 1813. Reprint: Penguin Books, 2003.
- Bodie, Zvi and Rachelle Taqqu. Risk Less and Prosper: Your Guide to Safer Investing. Wiley. 2011.
- Breeden, Doug. “An Intertemporal Asset Pricing Model with Stochastic Consumption and Investment Opportunities.” Journal of Financial Economics, pp. 265-96. 1979.
- Campbell, John and Luis Viceira. “Who Should Buy Long-Term Bonds?” American Economic Review 91.1, pp. 99-127. March 2001.
- Heldman, James. “How Wealthy is Mr. Darcy – Really?” Jane Austen Society of North America. 1990.
- Merton, Robert, C. “The Crisis in Retirement Planning.” Harvard Business Review. July–August 2014.
- Merton, Robert C. and Arun Muralidhar. “Time for Retirement ‘SeLFIES’?” SSRN. 2017.
- White, James and Victor Haghani. “The Equity Risk Premium: A Novel Perspective on the Past Fifty Years.” SSRN. March 2020.
- This not is not an offer or solicitation to invest, nor should this be construed in any way as tax advice. Past returns are not indicative of future performance.
Thank you to Bob Merton for his suggestions and for sharing his thoughts on this topic, to which his decades of research and writing have contributed so much. Thanks also to Vlad Ragulin (one of Bob’s many students) and Rich Dewey for their valuable comments.
- An annuity is a fixed sum of money paid each year, typically for a long period of time. A real annuity pays a fixed inflation-adjusted sum of money each year. US Social Security payments can be thought of as a real annuity, with a start date at entitlement age.
- As per data made available by Professor Robert Shiller here. We assume that the level of real rates did not change over these two periods. Nominal rates changed little, and unfortunately long-term real rate data does not exist for those time periods.
- A laddered portfolio of US Treasury Inflation-Protected Securities (TIPS) are the most like a real annuity that an investor could buy, and is a good candidate for the minimum risk asset an investor can buy.
- In this note, we focus on a risk-free Real Annuity as a benchmark and numeraire for assessing one’s financial resources and making investment decisions. However, an even more accurate metric would take account of the expected return and risk of the full investment opportunity set as well as one’s personal aversion to risk. Such a measure would use the long-term risk-adjusted return of an investor’s desired portfolio instead of the long-term risk-free real rate to compute the Real Annuity Value to be used as one’s personal numeraire.