April 9, 2025
Featured Insights
Where Did I Put My Investments?
By Victor Haghani and James White 1
ESTIMATED READING TIME: 7 min.
What’s the best way to distribute your stock and bond holdings between your taxable and non-taxable investment accounts? For most of the nearly 50 years since tax-advantaged savings accounts have existed in the US, the conventional wisdom has called for keeping stocks in your taxable account and fixed income in your 401k or IRA accounts.2 This orthodoxy was challenged during the decade-long stretch of super-low interest rates following the 2008 Global Financial Crisis, when many investors started shifting fixed income toward their taxable accounts. What’s the right distribution for today’s environment, now that interest rates are back up to more normal levels?
Financial advisors typically answer this question by first taking, as a given, how much stocks and bonds you want to own in aggregate. Then they assume fixed “base-case” returns for stocks and bonds, make tax rate assumptions, and figure out the distribution of those holdings which maximizes the amount of after-tax money you have at a chosen investment horizon.
We think it makes more sense to solve the joint problem of how much stocks and bonds to own and where to put them, all at the same time. As with all decisions involving uncertainty, we want to find the answer which maximizes your expected risk-adjusted return, not your base-case or expected return. This means that we have to go beyond the industry standard and explicitly account for risk in our analysis.
The solution will depend on a host of factors, so we’ve built a calculator you can use to see what makes most sense for you given your personal circumstances. The calculator gives not only the optimal decision, but also shows you how much you’d be giving up by going with alternative choices. In many cases, you’ll see that choices within a pretty broad range produce similar expected risk-adjusted returns, while in other cases, there is a lot to be gained by moving closer to the optimal allocation.
In this note, we’ll start off by describing the problem and how we approach solving it, then we’ll give some intuition for the different forces pulling and pushing solutions in different directions. We’ll then describe the calculator in some detail along with discussion of an example, and finally we’ll lay out some shortcomings and possible extensions of the calculator.
Problem Setup
We’ll take as a given how much wealth you have in your taxable account, your traditional IRA or 401k, and your Roth IRA or 401k. In this note, we don’t address the question of whether you should convert a Traditional to a Roth IRA, though the approach we describe can be used to make that decision too.
We need to know tax rates on all forms of income, both today and as you expect them to be in the future, as well as the expected return of stocks and bonds and the risk and dividend yield of stocks.3 Finally, your personal degree of risk aversion will be the primary factor that translates the expected return and risk of the investments into an optimal desired asset allocation.
Using these inputs, we can search over all combinations of holdings of stocks and bonds in the three types of account you can own, looking for the holdings which result in the highest risk-adjusted after-tax return to any chosen horizon. Risk-adjusted return is the lowest return you would be willing to accept to forego a particular risky investment portfolio. The more risk-averse you are, the lower the risk-adjusted return of any given stock-bond portfolio. Maximizing expected risk-adjusted return is the equivalent of maximizing the expected utility you get from a given set of investments.4 We also explore the use of leverage in the solution, assuming that you can borrow at a set spread to the bond rate.
Main Contours of the Solution
When the investment horizon is long, the effective tax rate on stock market investments is lower than the taxation of fixed income assets. This is because long-term capital gains tax rates and the tax rate on qualified dividends are lower than the tax rate on interest income. Also, taxation of capital gains can be deferred for years, which also reduces the effective rate of tax on stocks. However, there is a tax inefficiency of stock investments, which is that capital losses do not result in tax refunds.5 This asymmetry means that, to shorter horizons, stocks can have a higher effective tax rate than fixed income investments – even to long horizons, this asymmetry in capital gains treatment reduces the tax efficiency of stocks.
When interest rates are very low, the higher tax rate on fixed income assets doesn’t matter much, because there just isn’t a lot of income to be taxed. So, although stocks are more tax efficient, when interest rates are low, it can make sense to keep more fixed income in your taxable account. We are very partial to rules-of-thumb in financial decision-making, but in this case, the interaction between these different effects is complex enough to warrant a calculator which can keep track of all the pushes and pulls.
The Calculator
Below is a screenshot of our Asset Location Calculator. We hope most of the inputs and outputs are self-explanatory, but we’ve also included explanations for many of them which can be found by rolling over the information icons () positioned throughout the tool.
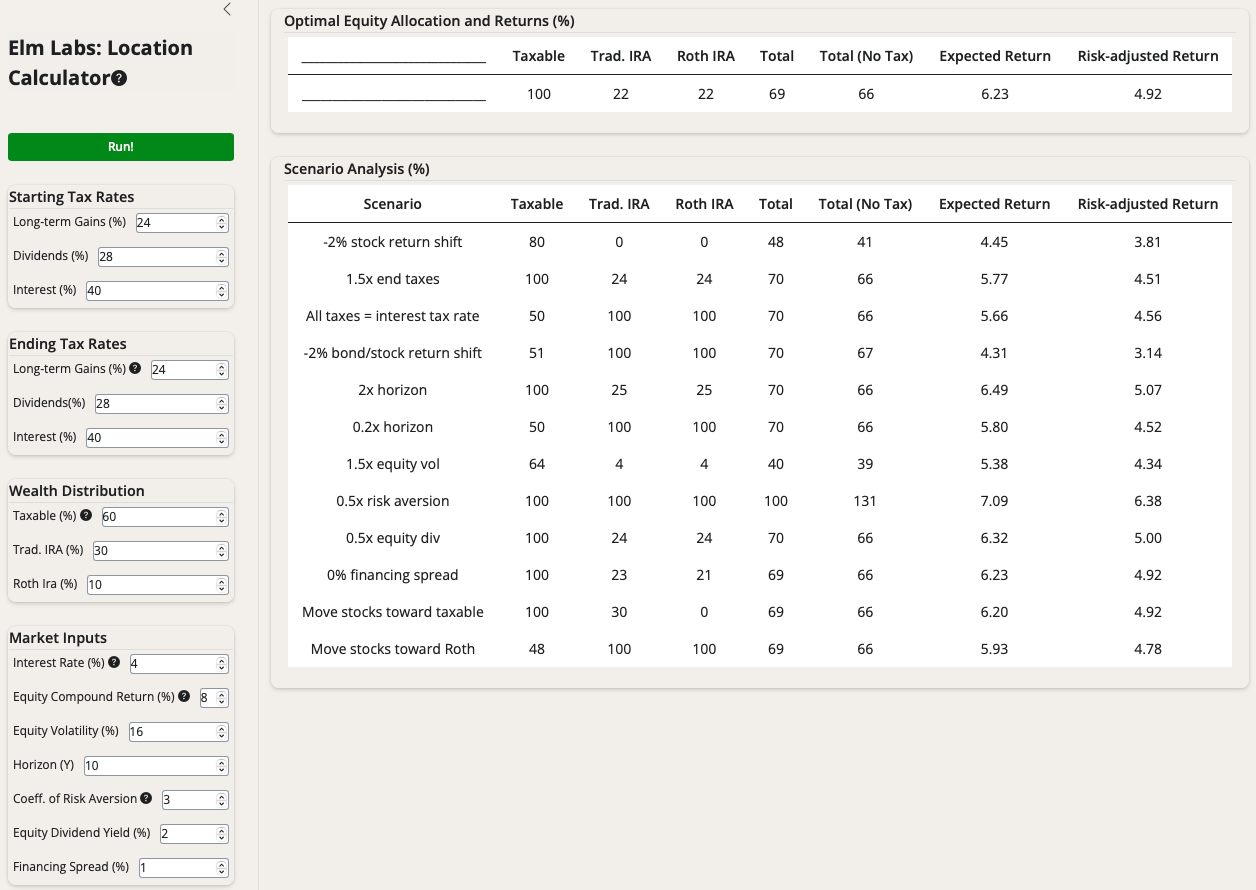
The numbers in the first three columns represent the optimal allocation to stocks for each type of account, and the fourth column shows the optimal equity allocation in aggregate. The “Total (No Tax)” column is the optimal fraction to invest in stocks if all your savings were in a Roth IRA, subject to no taxation at all.6 The columns of expected return and risk-adjusted return are both expressed after tax.
Note that the optimal solution calls for more equities (69%) than you’d own if you could invest without paying any taxes at all (66%). The equities you own in your taxable account count less than their full amount because the government is implicitly a “partner” with you through taxation of your upside returns. We discuss this in more detail in “Who is the Biggest Investor in the Stock Market, and Why Should You Care? and in Chapter 17 “Tax Matters” of our book, The Missing Billionaires: A Guide to Better Financial Decisions.
In the calculator’s Scenario Analysis, we show a number of different variations on the base case inputs. These allow us to see how robust the results are to different environments, and the magnitude of changes in welfare from different location policies. There are many interesting results in the scenarios in the lower panel, but here are a few that we thought were most thought-provoking:
- -2% stock return shift: As expected, the aggregate allocation to stocks drops most dramatically in the IRA accounts, and the rest of the reduction comes out of the taxable holding. One implication of this is that if you are attracted to dynamic asset allocation, you’ll want your IRA accounts to be more dynamic than your taxable account. This is something we often implement for our clients.
- 1.5x end taxes: Assuming that tax rates are 50% higher than the base case increases equity allocation overall slightly, and also pushes equities into Roth a bit.
- -2% bond/stock return shift: If we move both interest rates and the expected return of equities down by 2%, we find that holding equities in non-taxable accounts becomes more attractive.
- 0.2x horizon: at a short horizon, owning equities is less attractive overall, and also less tax efficient, so better to own them in non-taxable accounts. Risk-adjusted return is impaired markedly.
- 0% financing spread: notice that, even with 0% financing spread, it is still not optimal to use leverage in the taxable account, which is a result of the tax rate on interest being higher than that on dividends.
- Move stocks toward Roth: there is a loss of 0.14% in risk-adjusted return, a significant (but not huge) impact of getting location wrong for these assumptions.
The optimal solution for all of these scenarios above calls for holding the same fraction of equities in the Traditional and Roth IRAs. This will typically be the case except for very high levels of equity holdings.7
Shortcomings and possible extensions
Among the simplifications we made in the modeling of the problem, perhaps the two most impactful are: 1) the decision to do the analysis to a fixed horizon, rather than maximizing the lifetime expected utility of spending – including the impact of IRA Required Minimum Distributions (RMD) and 2) not directly modeling the risk that future tax rates may deviate from our expectations.
We also assume there are no unrealized gains or losses in your starting portfolio, and we did not model the effect of non-US dividend withholding tax. It is generally the case that it is preferable to own non-US equities in taxable accounts, so as to get the benefit of withholding taxes paid to foreign governments. The effective cost of losing the benefit of withholding taxes varies by region, from about 0.2% per annum for Asian and Emerging Market equities to about 0.3% for European equities.
If you plan to make charitable contributions of appreciated assets in the future, or expect to make use of step-up basis on death as part of your estate planning, you may want to reflect that by inputing a low (or zero) future tax rate on capital gains into the calculator. For more complex cases involving trusts and ongoing intergenerational gifting, we’d be happy to try to help you think through those decisions, though the asset location question tends to not be the most impactful in those sorts of cases we’ve seen to date.
While we are advocates of dynamic asset allocation, we feel that our assumption that expected returns and risk are constant over the horizon won’t materially affect the current asset allocation and asset location decisions significantly. For investors who want to follow a dynamic asset allocation approach to their investing, it is possible to do that extremely tax efficiently in a taxable account either through the use of tax-loss harvesting and tax-aware rebalancing decisions in a Separately Managed Account, or through a dynamic asset allocation ETF, such as our ELM Market Navigator ETF.
Conclusion
The decision of how much to allocate to equities in your portfolio and where to locate those equity holdings is a complex problem which requires a proper accounting of taxes and risk, combined with your personal degree of risk-aversion. We have a friend who concluded that, since stocks have a higher expected return than bonds, he should own equities in his non-taxable account so that he could keep all those gains and not share any with the government in the form of capital gains taxes. He even took this conclusion further, owning stocks with leverage in his IRA so that he’d get to the overall aggregate allocation to stocks that he wanted without having to own any equities in his taxable account. We owe him our thanks, since it was our discussions with him which encouraged us to build this calculator and write this note. We hope you will find it useful in your allocation and location decisions, today and into the ever-changing future.
Further Reading and References
- Haghani, V. and White, J. (2025). “Out of the Frying Pan and Into the Fire: Selling A Highly Appreciated Stock Without Paying Taxes?” Elm Wealth.
- Haghani, V. and White, J. (2024). “Direct Indexed Tax Loss Harvesting: Is the Juice Worth the Squeeze?” Elm Wealth.
- Haghani, V. and White, J. (2020). “Who is the Biggest Investor in the Stock Market, and Why Should You Care?” Elm Wealth.
- Haghani, V. and White, J. (2020). “To Realize, or Not to Realize.” Elm Wealth.
- Haghani, V., Hilibrand, L. and White, J. (2019). “When it Pays to Pay Capital Gains.” Elm Wealth.
- Haghani, V. and White, J. (2018). “Tax Efficiency and Dynamic Asset Allocation: Can We Have Our Cake and Eat It Too?” Elm Wealth.
- Haghani, V. and White, J. (2017). “How Much Should the Tax Tail Wag the Asset Allocation Dog?.” Elm Wealth.
- Haghani, V. and White, J. (2023). The Missing Billionaires: A Guide to Better Financial Decisions Chapter 17. Wiley.
Elm Wealth Tax Calculators
- This is not an offer or solicitation to invest, nor are we tax experts and nothing herein should be construed as tax advice. Past returns are not indicative of future performance. Thank you to Larry Bernstein, Larry Hilibrand, Doug Lucas, Bill Montgomery and Mike Piper for their many insightful comments and suggestions. Of course, all errors are our own.
- We’ll be framing the discussion in this article around US tax circumstances, but the principles and framework described herein are equally applicable in other jurisdictions, such as the United Kingdom.
- We assume stock prices follow a well-behaved random walk and bonds are risk-free to the chosen horizon.
- For the calculator, we assume you have Constant Relative Risk-Aversion (CRRA) utility and we apply it to your wealth, which we assume is in excess of your subsistence needs.
- That’s not entirely correct, as $3,000 of capital losses can be offset against ordinary income per year.
- We could have labelled this column the Merton share, as it’s what we’d get from the rule of thumb that takes expected excess return and risk of stocks as well as your personal degree of risk-aversion to give an optimal allocation to stocks. To get the 66% number, we need to convert the Equity annually-compounded long-horizon return of 8% and the 4% interest rate both into arithmetic continuously-compounded annual returns, and then plug them into the Merton formula: (8.97% – 3.9%)/(3 x 0.162) = 66.1%.
- The Traditional IRA can be thought of as the same as the “Roth IRA except smaller” because of the end tax rate applicable to the Traditional IRA distributions. There are other differences between a Roth and Traditional IRA, such as no RMD or early withdrawal penalties for the Roth IRA, and of course, a reduction in tax risk, but we have not modeled any of those differences in the calculator. If the allocations were not the same, then over time, the weighted allocation to equities from the two IRA account types combined would drift away from the average of the two and hence it is more risk-efficient for the allocations to equities in the two accounts to be equal. The calculator is set to not allow aggregate equity leverage. When your optimal equity allocation is very high, this leverage constraint comes into play and favors holding equities in the Roth IRA, since post-tax wealth in a Traditional IRA is lower than the same amount in a Roth IRA.