October 30, 2019
Indexing
There’s No Place Like Home: The Case For and Against Extreme Home Bias in Equity Investing
By Victor Haghani and James White 1
If you’re a US investor, international equity exposure has never been so readily available at such a low cost. Nonetheless, surveys indicate US investors typically allocate 80 – 85% of their equity holdings to US equities, much higher than their proportion of global market value. We recently wrote about how this kind of “Home Bias” can impact expected returns. Here we turn to evaluating 10 arguments often heard in support of high levels of Home Bias.2
1. US equities have outperformed non-US equities by 170% over the past 10 years
Ironically, we really couldn’t make the point for international diversification any better than this. Ten years ago, few would have or did put forward this magnitude of US outperformance as a likely scenario, but it happened.3 Over long periods of time, individual equity markets can significantly outperform or underperform in ways which are very difficult to predict, though easy to explain ex-post with the benefit of hindsight. Ten years sure feels like a long time, and it’s tempting to conclude that it’s long enough to draw some conclusions about what the next ten years will hold, but if ever there was a place to say it, it’s here: past performance is not indicative of future returns.
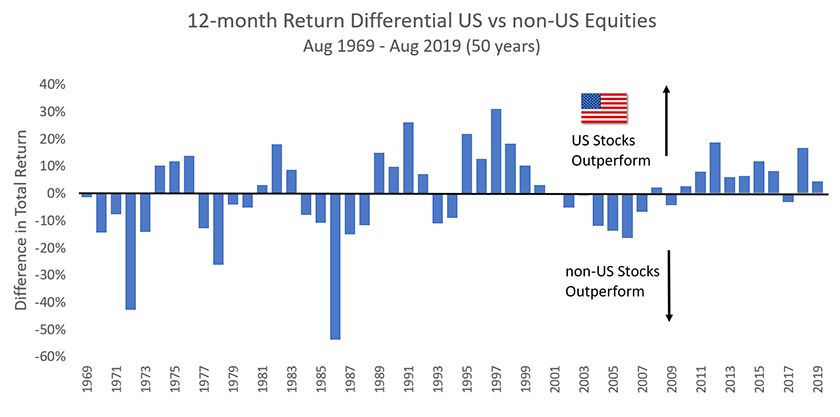
Sources: Bloomberg, MSCI, FTSE. Emerging Market equities included from December 1989.
2. Over the past 10 years, an internationally diversified portfolio wasn’t anywhere near optimal
The theory of diversification is not that a diversified portfolio is likely to ever look optimal in hindsight, but rather that it has superior risk/return characteristics looking forward given an uncertain future. A concrete example may be helpful:
Over the last 10 years, the portfolio that had the highest realized return-to-risk ratio (i.e. Sharpe Ratio), was a portfolio that had about 20 stocks in it, chosen from all members of the S&P 500.4 The reason everyone doesn’t now own just those 20 stocks is that many investors have an accurate sense that it will be a different small group of stocks doing the best over the next 10 years. And indeed, the best risk-adjusted “hindsight” portfolio from 1999-2009 is completely different than one from 2009-2019. The idea behind diversifying to own 500 stocks is not that 500 stocks will beat every combination of 20 stocks over any given period. Instead, the problem is we don’t know which will be the best 20 stocks looking forward, and without this knowledge, the diversified portfolio looks better than choosing a more concentrated portfolio. But, if you know the big winners with hindsight, they’ll always look a lot better than owning the diversified portfolio.
So too with international diversification. Over any given period, there’s very likely to be one or two markets which significantly outperform the globally diversified portfolio, and in recent years amongst major markets, that outperformer has mostly been the US. That doesn’t reflect a flawed theory of diversification, just a recognition that – in both theory and practice – the benefits of diversification are to be seen through the windshield looking at the road ahead rather than in the rear-view mirror.
3. Investors favor the familiar
This is completely understandable, but it’s a cognitive bias that can potentially come at a high cost. For most people still in their earning years, their human capital is often their largest asset, and domestic markets are much more highly-correlated with that human capital than are foreign markets. All other things equal, we’d be better off owning things less correlated with our primary asset, the very opposite of this bias.
US investors may be especially unaware of this subtle cost of concentration because the history of US equity markets has been so benign in our investing lifetimes. However, US investors in the 1930s or 1970s, Japanese investors in the 1980s, or Russian investors in the early 1900s and late 1990s all received a first-hand lesson in the value of international diversification.
4. International equities don’t offer much diversification, because whenever US equities experience a large correction, international equities usually go down as much or more
Over short horizons of days, weeks, and months, large moves are indeed typically shared by nearly all public equity markets. This is also true of equities within the same market, yet we intuitively understand that despite this, owning a portfolio of 500 stocks spread out over all sectors of the economy provides meaningfully more diversification than owning just a handful of stocks. While individual equities may often be highly correlated during large moves over short time periods, such as during the 2008 financial crisis, most investors have longer horizons over which these correlations tend to dissipate. This is true of the correlation between US and international equity markets as well, as we see in the chart below:
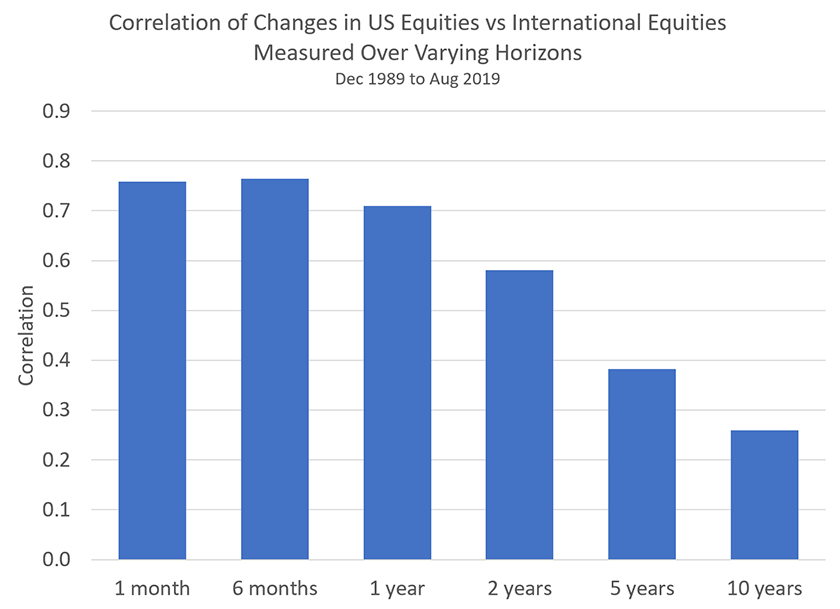
Sources: Bloomberg, MSCI, FTSE. Emerging Market equities included from December 1989.
A number of studies support the view that international diversification works over the long term as differences in underlying economic, demographic, political, social and regulatory fundamentals between countries and regions make themselves felt in equity market returns. For example, see International Diversification Works (Eventually) by Asness, Israelov and Liew (2010): “Over longer horizons, underlying economic growth matters more than short-lived panics with respect to returns, and international diversification does an excellent job of protecting investors.” Increased globalization has likely led to higher correlations among regional equity markets, but it’s far from clear whether this globalizing trend will continue or start to reverse.
There’s also an important point to make about the limits of the historical record: even a long past fails to plumb the depths of possible futures. Many events are possible which have never happened before and don’t show up in any data series. Diversification offers an effective first line of defense against low-likelihood but large-impact scenarios.
5. US companies earn a meaningful fraction of revenue internationally, thus investors get international diversification just from US equities
US equities do have substantial international earnings. However, all US companies share exposure to a long list of significant US-specific risks — economic, political, financial, regulatory, tax, labor, etc. These are important risks, and non-US stocks can provide diversification from them in a way that US stocks with significant international earnings streams cannot.
According to Morningstar, 35% of the revenue of US public market companies came from outside the US in 2018. While this may seem to provide broad exposure to international economic activity, it offers less diversification than it seems. US companies’ international revenues come from big companies in a concentrated set of industries. For example, in 2018, 60% of the revenues of the information technology sector came from non-US markets while the utilities, real estate and financials sectors received just over 10% of their revenues from overseas.5 And there are many segments of the non-US economy which US companies hardly touch at all, particularly in less open economies in the developing world.
6. Non-US equities are riskier than US equities
International equity market returns measured in dollars have been more volatile than US market returns. For example, since 1990, the volatility of US equity returns was 14.5% compared to 17% for non-US equities.6 However, this by itself is not an argument against diversification. The three main inputs into the “portfolio optimization” problem are volatility, return, and correlation – and all three matter. There is still a significant benefit from a large non-US allocation if non-US equities are more volatile than US equities, but also offer a higher expected return and diversification benefits through imperfect correlation. The “extra” volatility of non-US equities is known and should already be incorporated into market prices and thus into expected returns.
7. US investors spend their savings in dollars, and so they should only invest in dollars to avoid the currency risk associated with non-US equities
It’s a useful simplification to split investment assets into two buckets: minimum-risk assets (risk-free assets, in theory) and risky assets. An investor’s base level of expected future spending in retirement should ideally be supported by minimum-risk assets. To the extent that spending is going to be in one’s home currency, then the minimum-risk assets must also be in that currency.7 For a risky asset though, the main things that matter for how it fits in a portfolio are its expected return, volatility, and correlation with other investments. For a given level of volatility, return and correlation, it doesn’t matter that some of that volatility comes from currency risk rather than some other source. Hence, US investors should not shun foreign equities just because they are not denominated in dollars, as long as their expected return is sufficient given their contribution to overall portfolio risk.8 Additionally, although it may be difficult for US investors to imagine, there are circumstances when being diversified away from one’s domestic currency can be beneficial.
8. The US is the greatest place on Earth to invest
We agree that the US has been a terrific environment for business and this is likely to continue, but sadly this is no secret and so should already be reflected in the pricing of US equities. If anything, there’s little room for this common view to be strengthened over time, and significant room for it to be weakened.
9. Investing in non-US equities is difficult and expensive
This certainly used to be the case, but not so much anymore. The expense ratio of Vanguard’s non-US equity index fund (VXUS) stands at 0.09% down from a 0.45% initial average expense ratio for their European, Asian and Emerging Market equity index funds, launched in 1990, 1990 and 1994 respectively. While Vanguard’s US equity index funds with an expense ratio of 0.03% are cheaper than their non-US equity index funds, the gap is quite narrow at just 0.06%. There is still a tax wedge between US and non-US dividends as a smaller fraction of non-US dividends have the preferred “qualified” status, which, for high marginal rate US taxpayers, gives them a roughly 20% lower tax rate than non-qualified dividends. We estimate that the total of expense and tax differences adds up to about a 0.15% extra cost for holding non-US equities. In a simple mean-variance framework, this changes their optimal portfolio weight by about 5%, providing justification for a bit of Home Bias.9
10. US equities are about 55% of the MSCI global equity index, so isn’t owning 80-85% of US equities a pretty minor deviation?
The major index providers, MSCI and FTSE, include significant “investability” and free-float adjustment factors in their market weights. These adjustments make sense in the context of creating an index which can accommodate the benchmarking of trillions of dollars of investment, but they do have the effect of exaggerating US market weights. The raw, unadjusted global market value weight of US equities is closer to 35%, and it is expected to decline in the future as the developing world catches up with the US, so an 80-85% US allocation represents a dramatic departure from global market-value weights today, and in the foreseeable future.
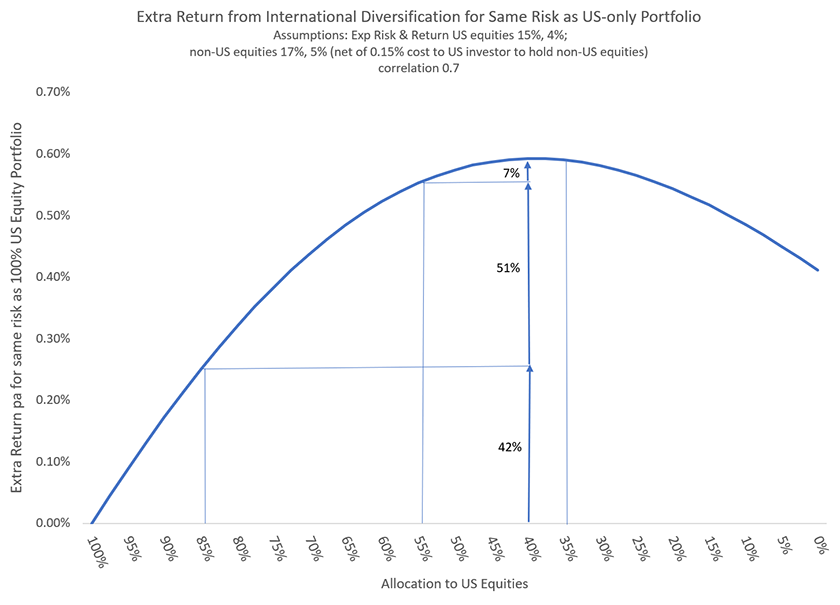
The chart below illustrates the expected gain possible from different levels of international diversification from a US investor’s perspective. It assumes 40% in US equities is the optimal weight, based on unadjusted global market value weighting10 while also taking account of the extra expense and tax costs of owning non-US equities. Moving from 100% in US equities to 85% captures only about 40% of the benefit of optimal diversification. Moving further to 55% in US equities captures more than 90% of the total diversification gain available. Notice that the closer we get to the optimal point, the gain curve becomes flatter and there’s less available gain from each 1% change in allocation.
Conclusion
You’ve probably gathered that we don’t find much merit in most of the arguments supporting a high degree of Home Bias in global equity investing. However, as seen in the chart above, there’s a relatively broad range of choices around the optimal allocation which are reasonable and which involve little sacrifice in portfolio quality. Indeed, Elm’s offerings use a Baseline US equity exposure of about 50%, significantly higher than the 35% raw market-value weight while still delivering the vast majority of expected diversification benefits. Some of this adjustment from 35% to 50% comes from the small extra cost associated with holding non-US equities, as described in [9] above. Most of it, though, comes from taking into account investor preferences, happily in a way which isn’t significantly sub-optimal.
This note reflects how we think about determining our “Baseline” allocation to US and non-US equities. This Baseline serves as the starting point for our dynamic asset allocation approach. Depending on the level of current expected returns for each asset bucket, we vary allocations away from the Baseline.11
Some of the above arguments for US Home Bias have been famously made by Warren Buffett, who has received a lot of attention for taking a strong “no-place-like-home” position. Indeed, he’s instructed his heirs to avoid non-US equities completely by taking all their equity exposure through a low-cost S&P 500 index fund. Perhaps he’ll reconsider his advice after reading this note.
Further Reading and References
- Asness, Clifford, Roni Israelov, and John Liew. “International Diversification Works (Eventually).” Financial Analyst Journal. 2011.
- Brinson, Gary and Roger Ibbotson. “Global Investing: The Professional’s Guide to the World Capital Markets.” McGraw-Hill. 1993.
- Bryan, Alex. “Investing Close to Home is Overrated.” Morningstar. 2019.
- Dimson, Elroy, Paul Marsh, and Mike Staunton. “Triumph of the Optimists: 101 Years of Global Investment Returns.” Princeton University Press. 2002.
- French, Kenneth, and James M. Poterba. “Investor Diversification and International Equity Markets.” NBER. 1991.
- Haghani, Victor, and James White. “Do US Industry-Sector Weights Explain the Higher Valuation of US vs non-US Equities?” Elm Partners. 2019.
- Scott, Brian, Kimberly Stockton, and Scott Donaldson. “Global equity investing: The benefits of diversification and sizing your allocation.” Vanguard Research. 2019.
- This not is not an offer or solicitation to invest, nor should this be construed in any way as tax advice. Past returns are not indicative of future performance.
Thank you to Gary Brinson, Jeffrey Rosenbluth, Larry Hilibrand, Antti Ilmanen, Vladimir Ragulin, Rich Dewey, Aneet Chachra and Joshua Haghani for their insightful and helpful comments, and to Paul White of Vanguard for providing us with information about the history of Vanguard’s international equity index offerings.
- We specifically focus on Home Bias as it relates to equities, as there are very different issues related to international fixed-income markets. We also assume the perspective of a US-based equity investor, though much of what’s said is relevant for non-US investors, especially given that no other market has nearly as large a weight in the global portfolio as the US.
- Indeed, many financial commentators were even expecting the US would experience a ‘lost decade’ of low or negative equity returns.
- From 2009-2019, the mean/variance optimal portfolio had 22 stocks in it and a realized, backward-looking Sharpe ratio of 2.4, vs 0.92 for the portfolio of all stocks in the S&P 500 present in the index over the entire period.
- From Factset report here.
- Annualized volatility calculated from monthly dollar returns.
- By this criterion, non-US bonds denominated in foreign currency would not be a suitable holding for this bucket.
- How much expected return one should demand or be willing to give up relating to currency risk depends primarily on the degree to which currency risk impacts the risk of international equities measured in dollars. There are good reasons to expect foreign equity markets to rise when their domestic currency falls, dampening the volatility in dollars, and we tend to see this in normal times. A very mild correlation in the range of 0.15 to 0.25 in this direction is enough to make the impact of currency fluctuations on non-US stock returns in dollars close to zero.
However, over the past twenty years, that normal relationship has been overwhelmed by global investors treating the US dollar as a safe haven and flocking to it in times of crisis. If global investors continue to behave in that way, then US investors in non-US equities should expect to earn some compensation for bearing the risk of non-safe-haven currencies.
- Using a correlation of 0.7 between US and non-US equities.
- We selected parameters of volatility and correlation of US and non-US equities that would make the unadjusted market value weights be the optimal mean-variance weights.
- For each asset bucket, the expected return forecast has a long-term component based on valuation, and a medium-term component based on momentum. You can read more about our asset allocation methodology here.