November 26, 2024
Risk and Return
Leverage It or Leave It? Making Sense of Turbo-charged ETFs
By Victor Haghani and James White1
Estimated reading time: 6 min.
Investors can now choose from about $100 billion in ETFs that provide leveraged long or short exposure to a broad range of popular stock indexes and individual companies. These ETFs are designed to deliver a daily return that is a multiple of the daily return of the underlying index or stock on which the ETF is based, less fees, frictions and the cost of leverage. For these leveraged ETFs, 2x and 3x are the most common multiples. It is well known – and stated in the prospectus and fact sheets – that beyond one day their return, even adjusted for fees and costs, will not be equal to the leverage multiple times the return of the underlying asset. The cause of this difference in longer-term returns is the daily rebalancing trades that the ETF needs to execute to keep its leverage constant through time. In general, the more volatile the underlying asset, the higher the leverage ratio, and the more time that goes by, the bigger the difference will be between the ETF’s return and the “multiplied” return of the underlying asset.
We have written about leveraged ETFs and this phenomenon twice before, featuring the hapless character of George Costanza, here and here. As a reminder of what’s going on here, let’s take a look at today’s largest leveraged ETF, the $25 billion Proshares Ultrapro QQQ (ticker TQQQ). It aims to deliver 3x the daily return of the Nasdaq 100 index (QQQ). Over the five years to September 30, 2024, the compound return on the underlying Nasdaq 100 index was 21.9%. If an investor expected to get a return close to 3x that 21.9%, he’d have been pretty disappointed. TQQQ generated a return of only 37.2%, not even two times the return of the underlying asset.2 Some of this shortfall is due to the cost of leverage3 and the 0.84% annual fees. But most of the shortfall is due to the daily rebalancing trades that must be executed to keep its leverage at the 3x target – buying the underlying QQQ every day it goes up and selling it every day it goes down.
Battle Stations!
“… these ETFs are likely designed for the type of investor that is probably a lot more active than they should be.” – Dan Sotiroff, Morningstar analyst
Now that you know how these “simple” leveraged long and short ETFs work, it’s time to wrap our minds around the latest version of this structure: the Battleshares leveraged long and short ETFs.4 These ETFs are designed to bet on the continued success of bold, disruptive companies while wagering against the old-school giants they’re set to replace. Each ETF will provide a leveraged long exposure of about 2x on the trailblazing company and a 1x short position on the legacy competitor. For instance, the “COIN vs WFC” ETF will take a turbo-charged 2x long position on crypto-asset bank Coinbase (COIN) while shorting 1x of traditional bank Wells Fargo (WFC). A table in the Appendix shows the potential lineup of Battleshare ETFs.
A Tool for a Fuller Picture of Returns
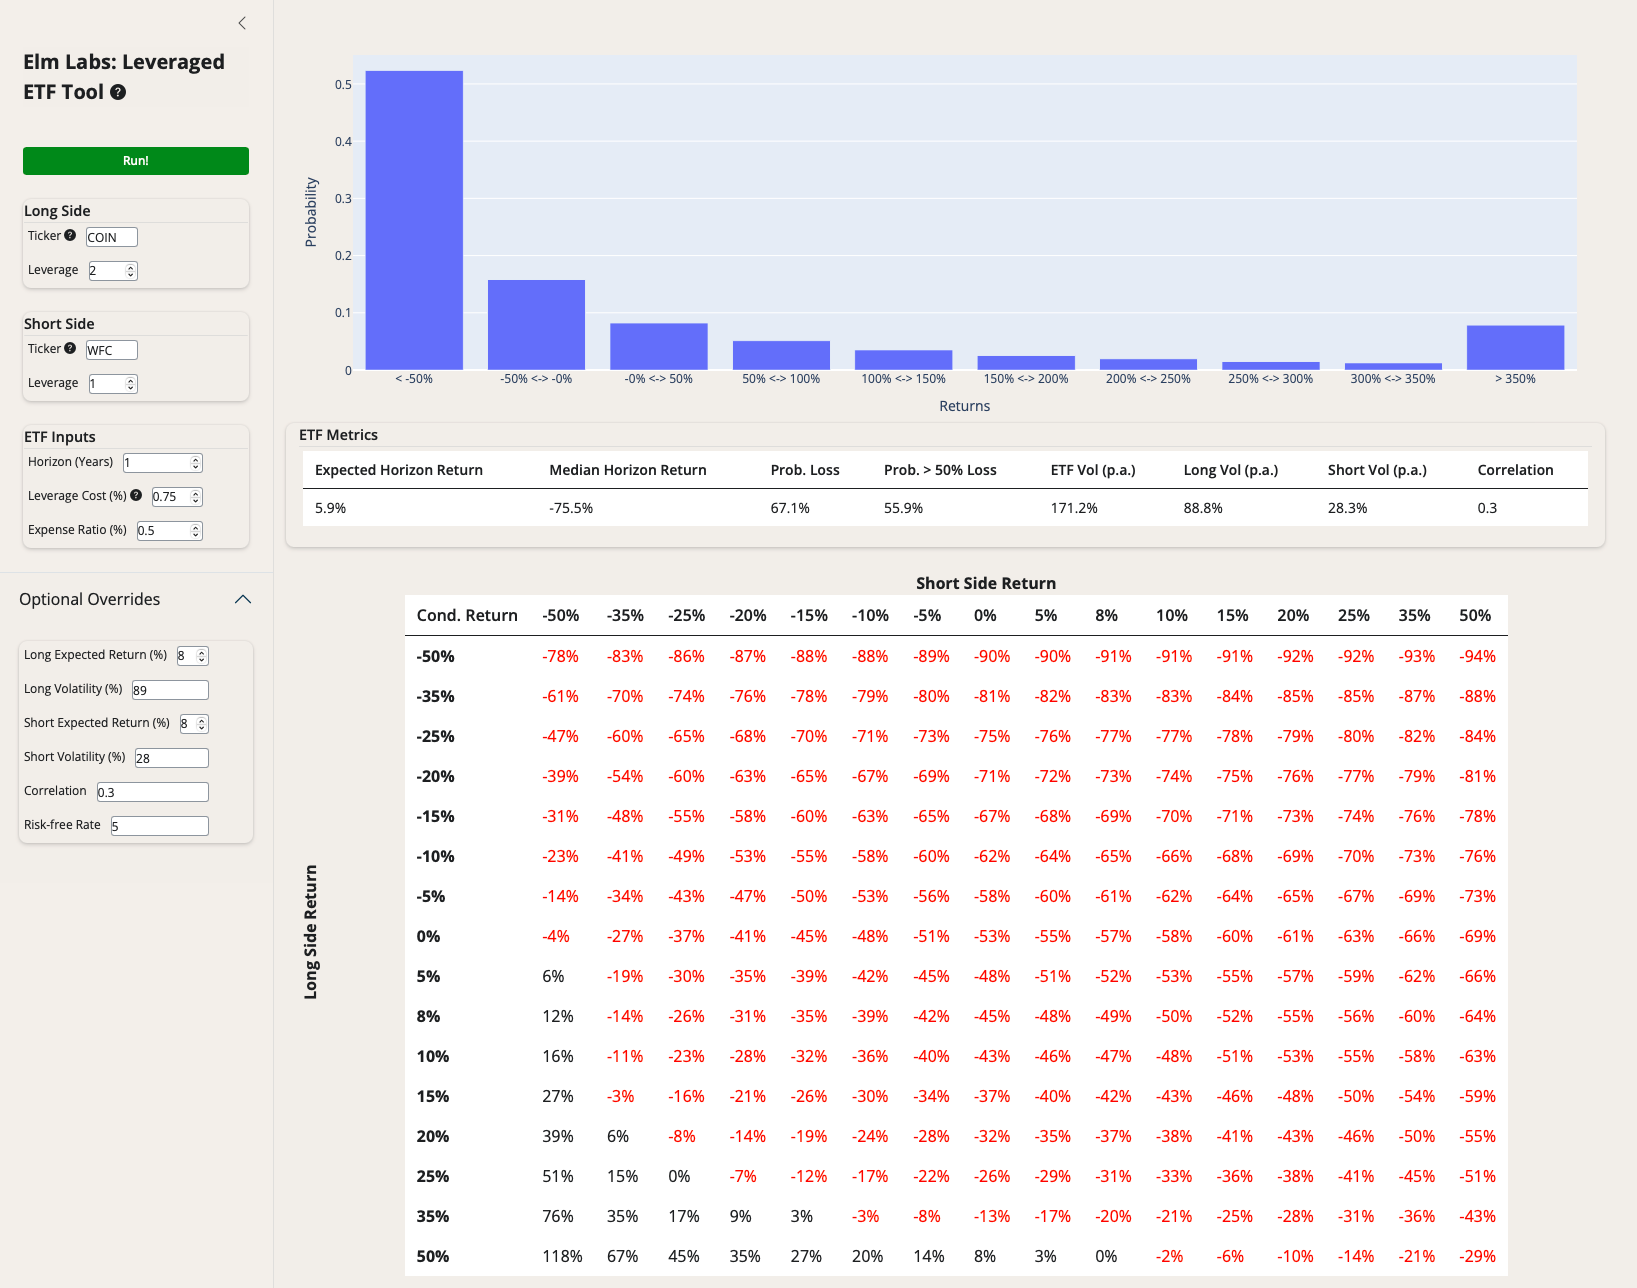
Given the increasing variety, complexity and growing interest in leveraged ETFs, we decided to build a tool that would generate a return distribution for any leveraged long, short, or long-short ETF structure, which you can find here. An example of the inputs and outputs of the tool are shown below, for the as-yet-to-be-launched Battleshares 2x long COIN vs 1x short WFC ETF.

Info-tips in the tool give details on the inputs and how it works. The output above uses volatility and correlation between the long and short assets calculated using the past two years of daily data. The default inputs for the risk-free rate is 5%. As an admittedly arbitrary starting point, we set the expected return of the assets to 8%, which we expect many users will want to override with their own expectations.
A few things to note in the output for this case, which uses the default assumptions above:
- If the 1-year return of COIN and WFC turned out to be 8%, the expected return on the ETF would be a loss of 49%.
- While the expected return of the ETF is 5.9%, the median return is a loss of 75.4%.
- To a 1-year horizon there is a 67% probability of loss, and a 56% chance of losing more than 50%.
- There’s a roughly 8% probability of the ETF going up more than 4-fold, making the return distribution of this ETF much like a lottery ticket or an out-of-the-money option.
It’s also noteworthy that an “opposite” ETF that would be structured to be 2x long WFC and 1x short COIN would also lose 50% conditional on the two stocks returning 8% for the year. We discussed how you can lose (a lot of) money on a trade and on its opposite in our 2019 note, “If George Costanza Were a Hedge Fund Manager.”
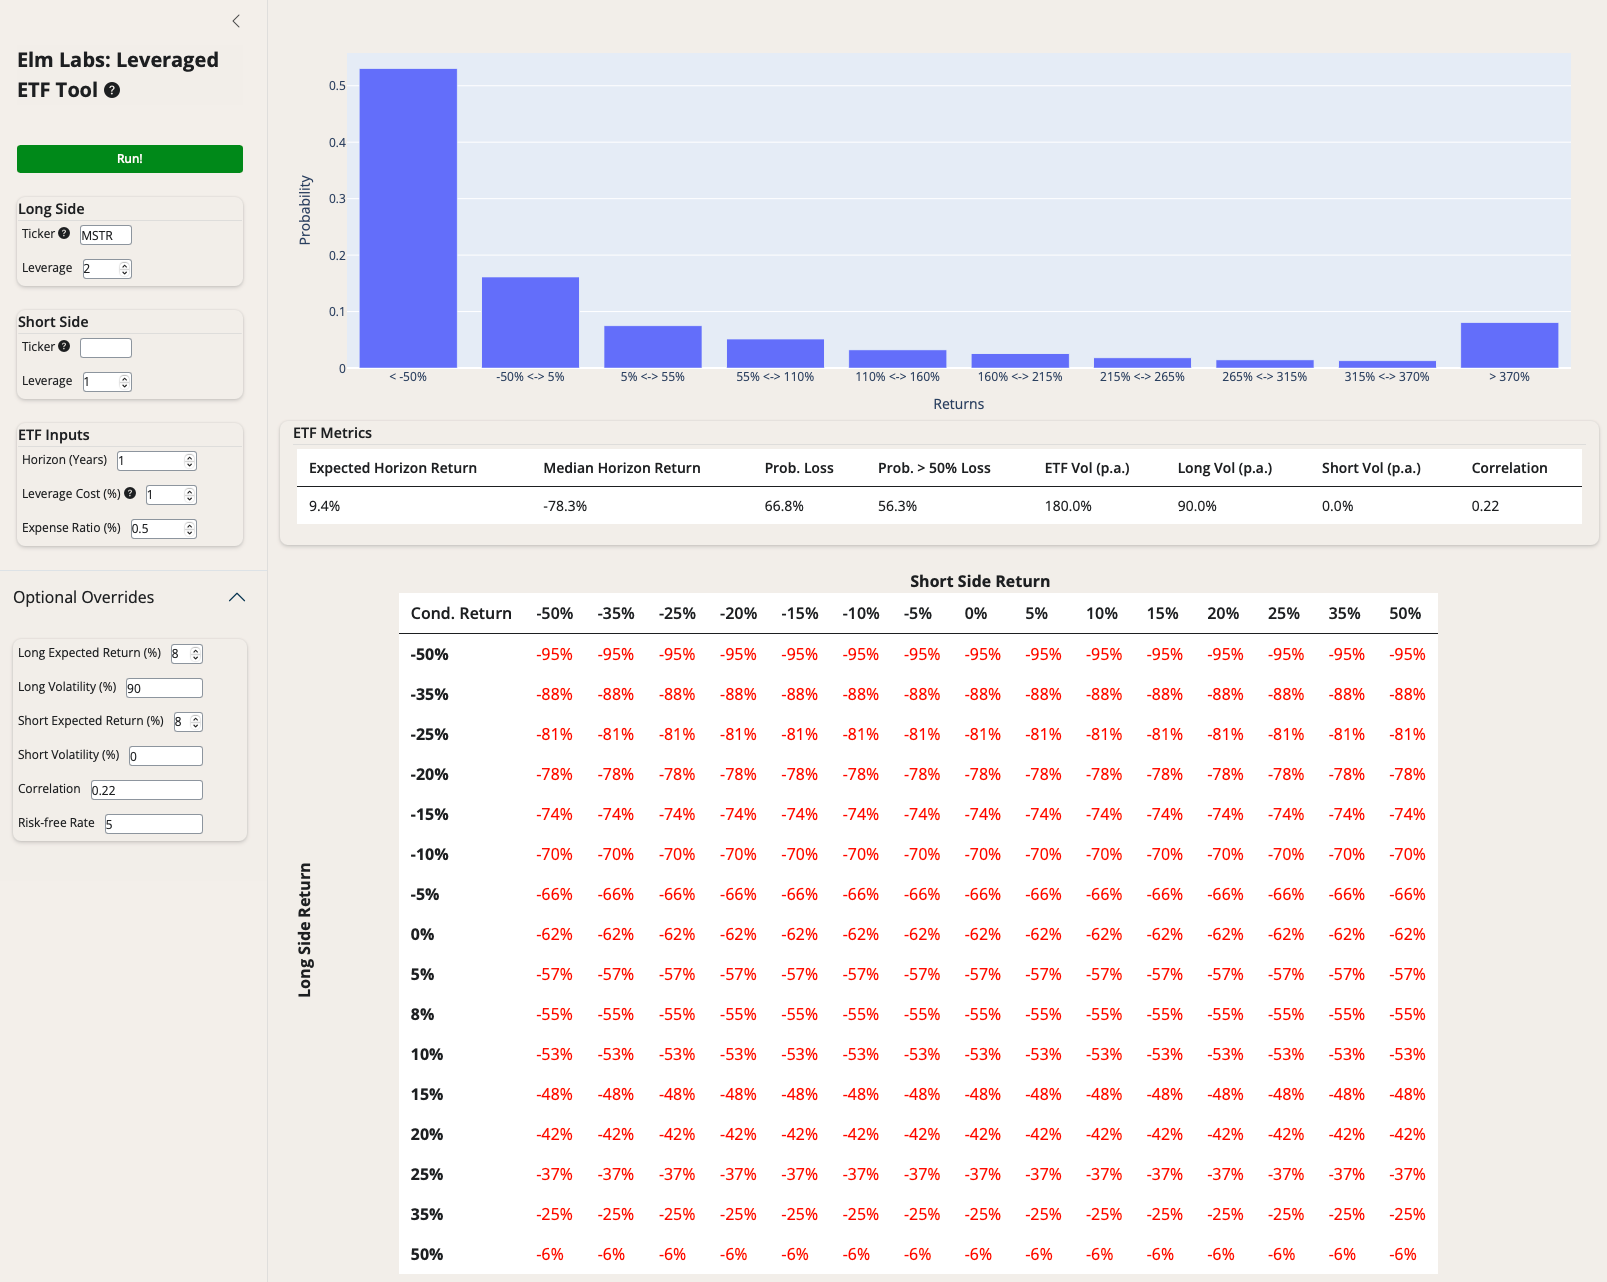
The tool can also be used for leveraged long or leveraged short ETFs, by leaving the ticker for the short or long asset blank or setting its leverage to zero. For example, the MSTX ETF gives a 2x leveraged long exposure to MicroStrategy Inc (MSTR), a large holder of Bitcoin with a side business in software. See output below.

In the Appendix, we show a table of the 60 largest leveraged ETFs linked to stocks or digital assets, along with their expected one-year median return. It’s interesting to note that there are no leveraged short ETFs among these 60 largest ETFs at the current time. This is mostly due to the market rally over the past few years comprehensively vaporizing the assets in those ETFs.
When do leveraged ETFs make sense for individual investors?
There’s a line of reasoning taken by some who say as long as there’s full disclosure, any voluntary trading between consenting adults is fine and good, and so leveraged ETFs always make sense. We don’t find this reductionist argument terribly persuasive, but even if we did, we don’t feel that investors benefit from full and clear disclosure with these ETFs. For example, in the few prospectuses we’ve inspected, we couldn’t figure out the cost of leverage involved, nor the potential cost associated with the daily rebalancing trades required.
But even with the fullest disclosure possible, we struggle to find cases where these ETFs, particularly those based on single stocks, would make sense as investment vehicles for investors with typical risk preferences.5
Conclusion
Leveraged ETFs have fascinating longer term return distributions, which at least some investors are likely to find surprising. These longer term returns are highly relevant. Investors in aggregate cannot escape them, even if every single individual investor had a one day holding period.
We hope the leveraged ETF tool we have made available on our website will help investors, commentators and researchers more easily visualize the highly asymmetric return distributions that arise from many of these ETF structures.
p.s.
We can’t close this note without a few words on the potential impact of the trades that these leveraged ETFs have to execute each day at the market close. There are about $100 billion of ETFs that are on average either 2x long or 1x short stocks or stock indexes. For every 1% that the underlying assets go up (down) in price, the ETFs will need to buy (sell) $2 billion of stocks at that day’s market close. On a very volatile day when the stocks underlying these ETFs move by 3%, there will be $6 billion of buying or selling at the market close, or approximately 1% of daily US stock trading volume. It’s not clear exactly how much price impact that amount of buying or selling would have, but everyone we talked to in the hedge fund equity trading business thought it would be noticeable.6
p.p.s.
There’s a new filing from Defiance for a 2x leveraged long ETF with ticker “HOT” that will give 2x exposure to 5 to 20 of the most volatile stocks. We suspect it won’t be long before HOT is overtaken by an even spicier structure.
Appendix: List of Leveraged ETFs

| Battleshares Proposed ETFs: Long 180-220% vs Short 80-120% | |
| NVDA vs INTC ETF | Nvidia versus Intel |
| TSLA vs F ETF | Tesla versus Ford |
| AMZN vs M ETF | Amazon versus Macy’s |
| COIN vs WFC ETF | Coinbase Global versus Wells Fargo |
| MSTR vs JPM ETF | MicroStrategy versus JP Morgan |
| NFLX vs CMCSA ETF | Netflix versus Comcast |
| LLY vs YUM ETF | Eli Lilly versus Yum! Brands |
| GOOGL vs NYT ETF | Google versus New York Times |
Source: Gil, D. (2024)
Further Reading and References
- Gil, D. (2024). “Battleshares ETFs aim to pit innovators against legacy peers.” Financial Times.
- Grinold, R. and Kahn, R. (1994). Active Portfolio Management. McGraw-Hill.
- Haghani, V. and White, J. (2023). The Missing Billionaires: A Guide to Better Financial Decisions. Chapter 23, “The Costanza Trade.” Wiley.
- Haghani, V. and White, J. (2019). If George Costanza Were a Hedge Fund Manager. Elm Wealth.
- Haghani, V. and White, J. (2020). George Costanza At It Again: The Leveraged ETF Episode. Elm Wealth.
- Hajric, V. and Tsekova, D. (2024). “Gamblers Are Sinking Billions Into a Leveraged Market Fringe.” Bloomberg.
- Pessina, CJ. and Whaley, RE. (2020). “Levered and Inverse Exchange-Traded Products: Blessing or Curse?” Financial Analysts Journal.
- This not is not an offer or solicitation to invest. Past returns are not indicative of future performance. We thank Aneet Chachra, Richard Dewey, Larry Hilibrand, Vladimir Ragulin and our Elm colleagues Jerry Bell and Steven Schneider for their comments and contributions to this note and the accompanying leveraged ETF tool.
- Returns taken from the Proshares factsheet.
- T-bills averaged about 2.25% over the period
- filed with the SEC by Tidal Investments and awaiting response
- We have a friend who says he’s run short positions in these ETFs, which he says has been quite profitable. Perhaps this qualifies as a sensible use case? We agree with the view of Pessina and Whaley (2020): “Levered and inverse ETPs are neither suitable buy-and-hold investments nor effective hedging tools. They are unstable and exist only as mechanisms for placing short-term directional bets. Levered and inverse products are not, and cannot be, effective investment management tools.”
- A common rule of thumb, as per Kahn and Grinold (1994), for market impact is k 𝝈 daily √(fraction of daily volume), with k usually around 1. So trades of 1% of daily volume with daily price volatility of 2% would be expected to move the market by about 0.2%. To the extent these flows are widely anticipated and occur in the closing auctions, the impact may be less.

 Previous