September 22, 2015
Indexing
How well do global market-cap weighted indexes represent the true “market portfolio”?
The most common map of the world is called the Mercator projection. It’s a compromise, as there is no perfect way to represent the shape, distance and land mass of our spherical world on a 2D flat map. School children know that while Greenland appears to be about as big as Africa, it is actually only 1/15th the size. The most commonly used representation of the global equity market is also a compromise. Index providers such as MSCI, FTSE and S&P base their indexes on market capitalization weights of freely investible public companies, which also results in a distorted picture.
The market cap weight paradigm comes from Modern Portfolio Theory (Markowitz 1952, Sharpe 1964), which tells us that to achieve maximum possible diversification we should seek to hold a portfolio of all assets weighted according to their market value, known as the “Market Portfolio.” It’s the only portfolio that everyone can own, if everyone were to own the same portfolio. Beautiful theory, but can we do better?
The chart below shows market cap weights for the main global economic regions according to MSCI and FTSE, relative to other possible weighting schemes. ‘Unadjusted Market Cap’ is the weighting we’d see if MSCI and FTSE did not take account of investibility and free-float. Markets such as China, India and Saudi Arabia have equity markets that are relatively closed to international investors; their weights are 1.6%, 0.7% and zero in the MSCI global index. However, if MSCI based their weighting directly on the value of exchange-listed companies, these numbers would be 8.4%, 2.3% and 0.7%, respectively, roughly 5 times higher.
Determining sensible geographic weights is complicated by the many multinational companies that carry on their businesses around the globe. The index providers recognize this issue, and their convention is to assign companies to one and only one country, based on considerations such as the location of incorporation, exchange listing and primary operations. This makes sense if we expect the multi-nationalism of companies in different regions to converge over time.
One frequently voiced concern with market cap weighting is that it has a tendency to overweight over-valued equities. Using corporate earnings rather than market cap is one way of addressing this concern, as it reduces the weights of those markets which trade at a higher PE multiples.
Public equity markets that are currently closed or small relative to the size of their economies are likely to become more open and larger, a recent reminder being Vanguard’s decision to include an allocation to China A-Shares in some of its index products (you can find our short report on that development here). Looking at relative regional GDP helps to adjust for these differences.
Taking account of relative population makes sense if we also expect per capita GDP to converge globally, and there is certainly a lot of room for convergence, with emerging market economies at about 1/10th the per capita income of the US.
Global Equity Weighting Schemes
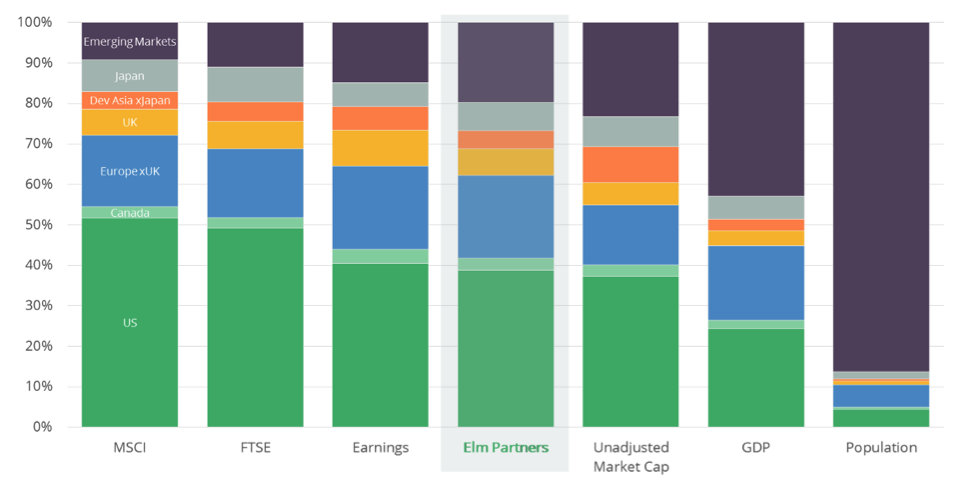
Sources: Bloomberg, IMF, Elm Partners research
If we had to choose just one of these perspectives, market cap weighting would be the winner. But who says we have to choose just one? A more inclusive and forward-looking approach, combining a range of relevant metrics, including market cap, should lead to a more diversified and representative portfolio than the market cap weighting scheme published by the main index providers, and should better approximate market-cap weights in the long-term. Just as with mapping the world’s land mass, drawing a map of the world’s risk assets requires compromises.
You can find a detailed description of how we draw our map of world equity markets here.