September 17, 2018
Investment Theory
Measuring the Fabric of Felicity
By Victor Haghani and James White 1
We steer our financial course through life choosing how much to spend and how to invest what’s left, periodically updating our choices as circumstances evolve. This is the essence of financial planning: specifying in advance a desired spending and investment policy conditional on relevant aspects of our life, varying investment opportunities, and our preferences for the benefits derived from our wealth. It’s a pretty simple problem to put into words but finding an optimal solution has occupied some very bright minds for the past 60 years, since Harry Markowitz got the ball rolling with his brilliant but highly-stylized one-period, static portfolio selection paradigm.2 Since then, researchers have made tremendous progress in both specifying and solving increasingly realistic and relevant formulations of this problem, with the goal of maximizing expected lifetime utility at the core of most formulations. In fact, academic research in this area has been so rich that it’s given birth to an entire academic discipline with dedicated university courses and textbooks.3
And yet, even though the study of this problem has delivered novel and valuable insights, we haven’t seen meaningful adoption by the financial planning or wealth management industries. The issue may in part involve the “utility” formulation so common in academia. Utility is a measure of the happiness, or felicity,4 we derive from using our wealth, and researchers generally presume that an investor knows her own “utility function,” which is to say the relationship between her wealth and utility. Unfortunately, sparingly little has been written about how an individual should calibrate her personal utility function. Financial planners may also worry that these relatively stylized academic models of utility don’t adequately represent investor preferences in the real world and fear their clients will be confused by a process grounded in an unfamiliar abstract formalism.
Are these reservations justified? We decided to create a short survey to address this question by testing whether a group of financially-sophisticated investors could comfortably communicate their preferences in a way which we could then translate into utility terms, and whether these preferences are reasonably consistent with core utility concepts. If the responses were affirmative, then we’d have reason to believe that putting the academic research findings into practice could have a big payoff. So, over the past six weeks, we gave the survey to a group of 31 friends and former colleagues from the finance industry.5 We make no claims that results from this selective sample are automatically applicable to broader groups, but we thought it would be a good starting point to see if there’s at least a kernel of people who would be comfortable thinking within this framework.6
Below is the survey.7 As we’ve done before in our research, we framed the survey questions using coin-flipping thought experiments.8 A utility-based framework is built into the structure of the questions, but you’ll see we don’t actually use the word “utility” anywhere in the questions, as we hoped to bring as few preconceptions into the survey as possible. We’d value getting more responses, so please take the survey here if you have a few minutes to give it some thought before reading on.
- Imagine you are presented with a one-time investment opportunity where the outcome depends on whether a fair coin flip comes up heads or tails. The coin flip is uncorrelated with your existing portfolio of investments and consumption and bequest plans. If it comes up tails, you lose 10% of your wealth. Which of the following amounts of upside would make you feel most ambivalent between accepting or declining the coin flip? If you can’t decide between two options, tick both. In case it helps, the Sharpe Ratios of the different options are 0.05, 0.11, 0.18, 0.26 and 0.34 respectively.
- 11%
- 12.5%
- 14.5%
- 17%
- 20.5%
- Same question as above, but now the downside if the coin comes up tails is you lose 20% of your wealth. Which upside would make you feel most ambivalent? Again, if you are finding two answers close, tick both. The Sharpe Ratios are 0.11, 0.25, 0.44, and 0.80 respectively.
- 25%
- 33%
- 50%
- 175%
- I wouldn’t risk losing 20% of my wealth for any of these upsides.
- Still flipping a fair coin. Now imagine that if it comes up heads, your wealth will increase 5-fold. What’s the most downside you’d accept to take that flip? Again, if your answer is between two options, please tick both.
- 80%
- 50%
- 30%
- 20%
- 15%
Before proceeding, we need to explain a little about how we picked the specific values in answers (a)-(e). The family of utility functions most commonly used in the academic literature is called Constant Relative Risk Aversion (CRRA) Utility.9 It’s hard to beat for simplicity, requiring just one parameter: the coefficient of risk aversion. One of the fundamental insights of the utility framework is that an individual’s utility curve defines her risk preferences, and in particular her level of risk aversion. Risk aversion comes from the asymmetry in utility between positive and negative changes in wealth. The parameter which describes the curvature of the utility function (the asymmetry) therefore also describes the level of risk aversion.10
Answers (a)-(e) each reflect one particular level (1, 2, 3, 4 and 5) of risk aversion. So, for example, an individual who displays CRRA Utility with a risk aversion level of 3 would choose answer (c) in all 3 questions. Two “ideal” individuals whose preferences are well represented by CRRA utility and who have the same coefficient of risk aversion would answer our survey in the same way, regardless of their wealth.11
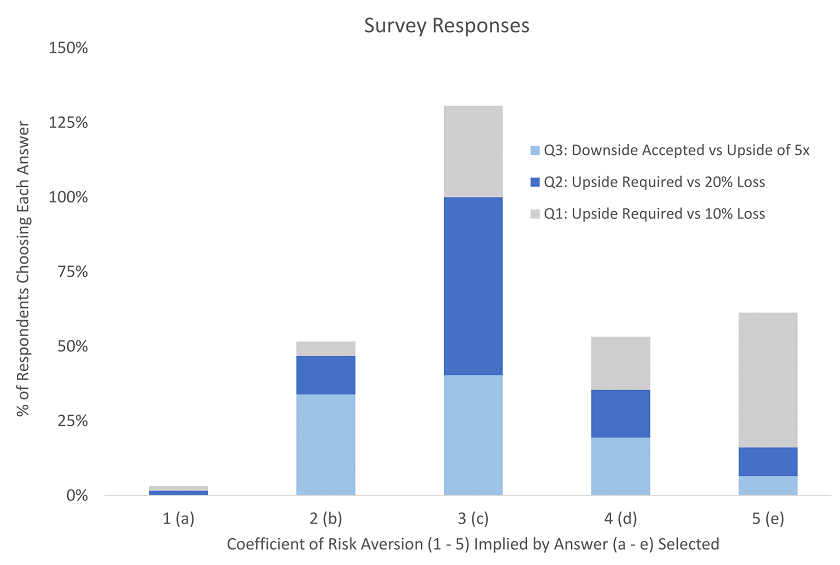
And now to the survey results. In sum, we were encouraged by the responses. You can find the full response data here and summarized in the chart below.
Here’s what we take away from the survey data and follow-on conversations:
- The style of calibration questions we used appears reasonable and comfortable to answer for our particular group, with not one respondent needing clarification before answering the questions.
- The risk preferences of our respondents seem broadly consistent with CRRA utility. Respondents tended to answer the three questions in a consistent fashion. Most selected nearby letters or the same group of letters across all three questions. Had answers been selected at random, the average expected variation per respondent would have been 50% greater across the three questions.
- The level of risk aversion evidenced by our respondents is strongly clustered around choice (c), equivalent to a risk aversion level of 3, as indicated in the bar chart above. We think Q2 is the mostly broadly relevant of the three questions, and the average value of answers to Q2 was 3.2, with not one person choosing (a) and only three choosing (e).12 The average value for Q3 was 3.0.13
We’d like to give a flavor for what’s implied by a risk-aversion level of 3. In line with the survey, an “ideal” investor with CRRA risk-aversion of 3 would never risk more than 30% of her wealth on an even-odds gamble regardless of the upside, and would need at least 50% of upside to risk 20% of her wealth. In an investing context under the most basic set of assumptions, such an investor would optimally invest 50% of her wealth if her only investment opportunity were a risky asset with an expected excess return of 4% and standard deviation of 16%.14 We look forward to writing a lot more about this topic in coming notes, using increasingly realistic sets of assumptions.
Before concluding, we feel a few caveats are in order. The thinking of our respondent group may not be representative of the broader population. Seven have PhDs in finance, and four have published relevant research papers. Caution is also called for in light of the extensive body of behavioral finance research, much of it in the area of Prospect Theory, which holds that people systematically make choices inconsistent with the classical utility functions that we used in our survey.15 Furthermore, psychological studies suggest that most of us are not very good at knowing how we’ll feel in different future scenarios.
However, there’s no escaping the type of questions posed in our survey if we want to make sound long-term financial decisions. An imperfect calibration of our preferences is likely better than no calibration at all. An approach that ignores or denies the premise of decreasing marginal utility of wealth will likely find itself trying to maximize expected future wealth, which can produce dangerous and nonsensical policy recommendations.16
We’ve been encouraged by the results of this survey and are looking forward to taking the next steps towards applying the valuable and extensive body of academic research to the real world financial planning and investing challenges faced by us all.
- Victor is the Founder and CIO of Elm Partners, and James is Elm’s CEO.
Past returns are not indicative of future performance. This not is not an offer or solicitation to invest. Thank you for the helpful comments and guidance of Chi-fu Huang, Jeff Rosenbluth, Andy Morton, Vlad Ragulin, Ben Miller, Ayman Hindy, Larry Hilibrand, Aron Landy and all our friends who generously shared their time with us in taking our survey. - Harry Markowitz, Portfolio Selection. The Journal of Finance. pp 77–91 (Mar 1952).
- The discipline is often called Lifetime Portfolio Choice and Consumption. Many consider the seminal paper Robert Merton’s Lifetime Portfolio Selection under Uncertainty: The Continuous-Time Case, The Review of Economics and Statistics, Vol. 51, No. 3 (Aug. 1969). For a brief overview, see John Campbell, Strategic Asset Allocation: Portfolio Choice for Long-Term Investors, NBER, (2000).
For an in depth treatment, these books: John Campbell and Luis Viceira, Strategic Asset Allocation (2002), John Campbell, Financial Decisions and Markets (2017), Robert C. Merton, Continuous Time Finance (1992), John Cochrane, Asset Pricing (2005).
- felicity: the quality or state of being happy. The “fabric of felicity” is attributed to utilitarian Jeremy Bentham:
“Nature has placed mankind under the governance of two sovereign masters, pain and pleasure. It is for them alone to point out what we ought to do, as well as to determine what we shall do…The principle of utility recognises this subjection, and assumes it for the foundation of that system, the object of which is to rear the fabric of felicity by the hands of reason and of law.”Introduction to the Principles of Morals and Legislation, Chapter 1, (1789).
- Our 31 respondents were a pretty special group, intentionally chosen to be highly financially sophisticated. The majority are investors with Elm Partners. All are reasonably affluent too, stating that their current wealth was significantly in excess of what would be needed to support their basic consumption needs.
- Although our sample represents a small niche of investors as a proportion of all investors, it’s large in absolute terms, and influential.
- Another approach would have been to ask people about their investment portfolios and their assumptions of expected return and risk of their portfolios in order to back out an implied degree of risk aversion from their portfolio choices. We felt that would be considerably more complex and blurred by other considerations that respondents might bring to their decision making, such as the degree of mean-reversion in equity markets, making it difficult to isolate the characteristics of their utility functions.
- We continue to like posing the questions in terms of ambivalence or indifference between accepting or declining a gamble, as we discussed in this note: How Much of a Good Thing is Best for You?
- U(W) = (1 – W1-ƞ)/(ƞ – 1) for ƞ ≠ 1, and U(W) = ln(W) for ƞ = 1 , where ƞ is known as the coefficient of risk aversion. See this Wiki article.
In addition to the simplicity, plausibility and tractability of CRRA Utility functions, a line of reasoning known as Portfolio Turnpike theory states that for long-term horizons, investor preferences are likely to converge to CRRA utility. See Mossin, Optimal Multi-period Policies (1968) or Cox and Huang, A Continuous-Time Portfolio Turnpike Theorem (1992).
- The degree of curvature of one’s utility function is also at the center of the spend-now versus save-and-spend-more-later decision. The greater the curvature, the greater the inducement required to defer consumption. We expect to delve deeper into the mechanics of this in upcoming notes.
- Assuming their “subsistence” spending needs are a small fraction of total wealth.
- A choice of (a) is equivalent to “log-utility”, the most commonly used level of risk-aversion amongst academics, and of interest to gamblers through the original statement of the Kelly Criterion.
- We also expected to find that respondents would evidence a higher level of risk aversion for smaller gambles than larger ones, and indeed we found this to be the case. The average coefficient of risk aversion to Q1 (10% downside) was 4.0, while for Q2 (20% downside) it was 3.2. It is worth noting that for very small gambles, investors should logically be willing to accept a very small edge, as the price of risk should be proportional to variance, or bet size squared.
So, for an investor with coefficient of risk aversion of 3, say with $1mm of net worth, she should be indifferent to a fair coin flip of lose $10,000 versus gain $10,300, but we’ve observed that in practice most people demand a much bigger edge than that for small gambles. We are not overly disturbed by this tendency, as what really matters for the Lifetime Portfolio Choice and Consumption problem we are concerned with is risk aversion to more substantial risks.
- As per the Merton rule: µ / (ƞ σ2) , where µ is the expected excess return over the risk-free rate, σ is the standard deviation of returns, and ƞ is the coefficient of risk aversion. See this Wiki article, or Merton’s original 1969 paper, Lifetime Portfolio Selection under Uncertainty: The Continuous-Time Case (page 253, equation 29′).
- Behavioral finance mostly focuses on the question of what people actually do, not on questions of what people should do. The idea that behavioral heuristics, like those arising from classical utility functions, could help reduce inherent bias and produce more optimal outcomes is not inconsistent with behavioral finance generally. Other criticisms of the classical utility framework argue that people systematically display internally inconsistent preferences, for example as suggested by the Allais paradox.
- Even with technical constraints such as an arbitrary threshold on the probability of going broke.