October 2, 2017
Investment Theory
Market Multiple Mean-Reversion: Red Light or Red Herring?
By Victor Haghani and James White 1
This post was first published on Bloomberg Prophets.
There may be many reasons to worry about the current record price levels of U.S. equities, but agonizing over the fallout from valuations reverting back to their historical averages should not in itself be high on the list. In fact, deviations from the mean for one popular valuation measure – the cyclically adjusted price-to-earnings ratio – don’t actually tell us much about expected market returns.
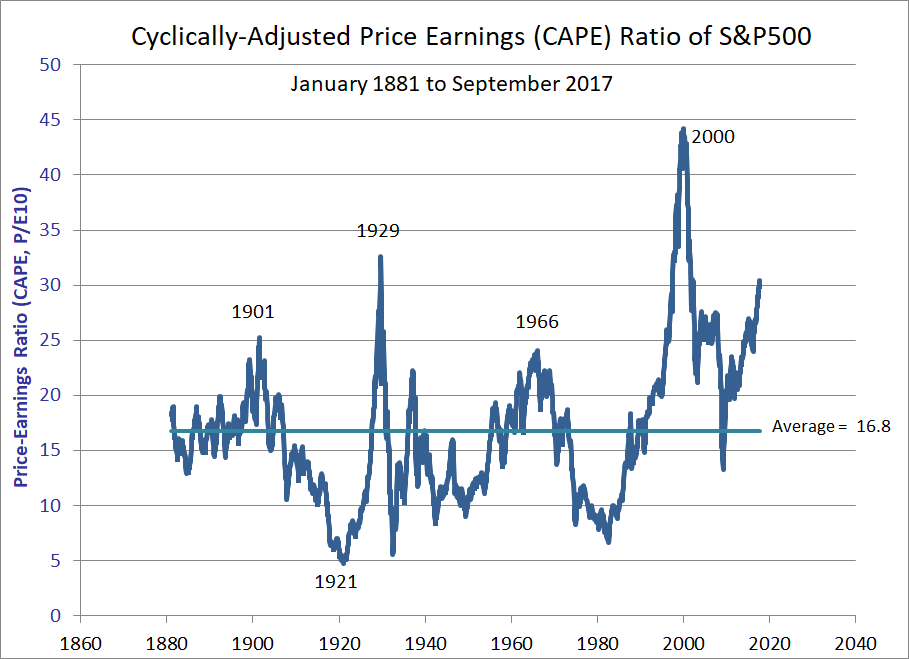
What makes this particularly important now is that the CAPE stands at 30. The CAPE was equal to higher than it is today in only 59 of the 1,640 months going back to 1881, or less than 3.6 percent of the time. 2 On average it takes about five years for the CAPE to move halfway back to its 16.8 historical average, based on a simple regression analysis.
Investors are understandably concerned that if it’s correct to expect the market to revert to a CAPE of about 24 over the next five years, then equities should drop about 22 percent, assuming earnings stay constant. No wonder so many are waiting for a stock market correction before putting more of their savings to work.
Data courtesy of Yale professor Robert Shiller. 3
Although there is statistical evidence that the CAPE is indeed mean-reverting, this process isn’t as strong as it can appear from the chart above. There’s a well-known result referred to as “reversion-to-the-mean bias,” which is that even random events, which by definition have no mean-reversion, often appear to be doing so for a while, sometimes quite a while, if the observer wrongly assumes that the recent level is the true mean. That’s essentially what we’ve done by looking at the CAPE history relative to the mean calculated from today’s vantage point. Elroy Dimson, a London Business School professor and renowned stock market historian, sees this as a big effect: “Much of the evidence for mean reversion is based on optical illusions based on hindsight.”
Also, a significant amount of the CAPE’s mean reversion is realized by earnings catching up with stock prices, rather than the other way around. For example, assuming the S&P 500 and earnings stay roughly where they are, the CAPE will drop from around 30 to about 25 in three years as the depressed earnings of the 2007-2009 period drop out of the 10-year lookback window for the CAPE.4
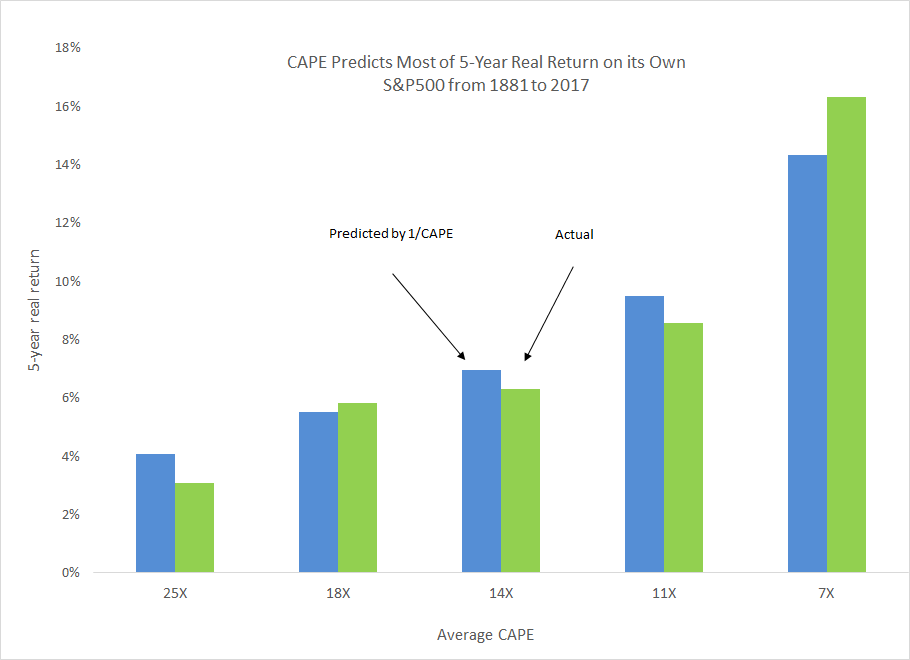
Most importantly, the outright level of CAPE, or more precisely, the cyclically adjusted earnings yield, known as 1/CAPE, is itself a pretty good predictor of future real equity returns.5 This makes it hard for another metric based on CAPE, such as its deviation from its mean, to add much information. The cyclically adjusted earnings yield when used by itself in a linear model explains about 25 percent of the variation in realized 10-year equity returns. Adding CAPE’s deviation from its mean as a second factor fails to explain any meaningful additional variation, indicating it has little extra predictive power.6
Today’s CAPE is telling us that we should expect equities to give us a real return in the long-term of 1/30, or about 3.33 percentage points, above inflation. This is a lot less attractive than the real return of 6.4 percent delivered by the U.S. stock market since 1881, though it’s somewhat more attractive compared with today’s long-term real rate offered by U.S. Treasuries of just under 1 percent.
As CAPE changes over time, the expected return of equities will also vary. Investors should be dynamic in their asset allocation, sizing exposure roughly in proportion to expected return.7 All else equal, investors should want to own less equities given today’s expected return than if CAPE was at 20 and the expected return was 5 percent (1/20). However, most investors would want to own no equities – or even run a short position – if they believed they’d be taking a 22 percent hit caused by CAPE reverting halfway back to its average over the next five years.8
History and common sense tell us that paying a higher earnings multiple for equities lowers the return one should expect to earn. History, however, is not telling us that a mean reversion of the CAPE is likely to deliver either a hit, or a windfall, to equity returns. Of course, history is not necessarily indicative of the future, and investors may have other reasons to expect equities to perform worse or better than predicted by 1/CAPE, especially in the short term. A historically driven fear of mean reversion should not be one of them.
- Victor is the founder and CEO of Elm Partners, a HNW Robo-investment manager. James works with Elm Partners in addition to pursuing his own research and investment interests.
- Of course, much has changed since 1881, when the U.S. flag had only 38 stars.
- Data can be found here. CAPE was popularized in Campbell and Shiller’s “Stock Prices, Earnings and Expected Dividends,” found here. The idea goes even further back, to Graham and Dodd’s famous work “Security Analysis” (1934).
- We find that on average, for every 10 percent the CAPE has been above or below its historical average, 10-year real average earnings increase (or decrease) by about 2 percent relative to their long-term average growth rate, which accounts for about 20 percent of the superficial mean-reversion we see in the CAPE data.
- That 1/CAPE is a good predictor of the real return of the equity market is consistent with a story that corporate earnings would grow with inflation if they were paid out in full each year. You won’t be surprised to learn that professors Shiller and Campbell were among the first to write about this too in their 1988 paper. There are other equally powerful predictors, similar in spirit to 1/CAPE, such as ones that use dividend yields and real dividend growth parameters to predict equity returns.
- We’re describing very simple linear models here, but there’s no evidence that more complex models produce different results, and Ockham’s Razor would counsel us to err on the side of simplicity. We’ve also made a choice to focus on a relatively long realized return horizon, namely 10 years. When looking at shorter horizons, 1/CAPE explains much less of the variation in return, and CAPE’s deviation from the mean similarly adds very little.
- Most frameworks for asset allocation, such as the Merton Rule, suggest investment should be proportional to excess expected return.
- Some people feel the expected return should be thought of as a bit higher than that, taking into account of the positive convexity of equities – that is, that equities can go up a lot but cannot go down more than 100 percent. More in this note here.