August 7, 2023
Investment Theory
A Closer Look at “Cut Your Losses Early; Let Your Profits Run”
By Victor Haghani, Vladimir Ragulin and James White 1
“You know, some clichés are clichés because they are true.”
– George Carlin
The first book that many new arrivals on the trading floors of banks and hedge funds are encouraged to read is Reminiscences of a Stock Operator by Edwin Lefevre (1923). The story highlights the importance of controlling one’s emotions in trading while being attuned to the herd mentality that often drives markets. The following two quotations reflect these twin themes of individual discipline and the pack-like movement of crowds:
“Cutting losses quickly is the foremost rule of speculating.”
“The big money is not in the buying or the selling, but in the waiting.”
For many successful speculators, “Cut your losses early; let your profits run” tops the list of advice they offer to the next generation of traders, as was the case with 12 out of the 14 renowned money men interviewed by Jack Schwager in Market Wizards: Interviews With Top Traders (1989).2 Here’s how one of the interviewees, Paul Tudor Jones, expressed it: “If I have positions going against me, I get right out; if they are going for me, I keep them.” This dictum is not lost on today’s most successful money managers, such as the Millennium, Balyasny and Exodus Point hedge fund groups, who put the tenet of cutting losses quickly at the very core of their investment and risk management policies.
Of course, this advice is far from universally accepted, and there are many situations where there is agreement that it’s not the right thing to do. Many people believe the qualities of perseverance, loyalty and determination are essential ingredients of success. The well-known author and psychologist Angela Duckworth wrote a popular book dedicated to this idea, aptly titled Grit. In it, she writes, “People who accomplished great things…often combined a passion for a single mission with an unswerving dedication to achieve that mission, whatever the obstacles and however long it might take.”
In the narrower sphere of investing, a number of financial economists – such as 2022 Nobel prize winner Phil Dybvig – have criticized the idea of a preset exit from an investment as being suboptimal at best and indefensibly irrational at worst. His 1988 paper “Inefficient Dynamic Portfolio Strategies or How to Throw Away a Million Dollars in the Stock Market” argues that strategies that cut risk to zero following losses are strictly suboptimal if asset prices follow random walks and investors exhibit smoothly decreasing marginal utility of wealth.3
However, most practitioners believe that there are times when markets don’t follow the well-behaved random walks which underlie many elegant formulas of modern finance. The rest of this note will explore two cases in the context of investing where the policy of cutting losses quickly and letting profits run (which we’ll abbreviate to CLE-LPR) can make sense. If you’re interested in the question of whether CLE-LPR makes sense in the broader context of other life decisions, read “Heads or Tails: The Impact of a Coin Toss on Major Life Decisions and Subsequent Happiness.” (Levitt, 2021), or watch Victor’s short TEDx talk: Quitting is for Losers Winners. (Haghani, 2017).
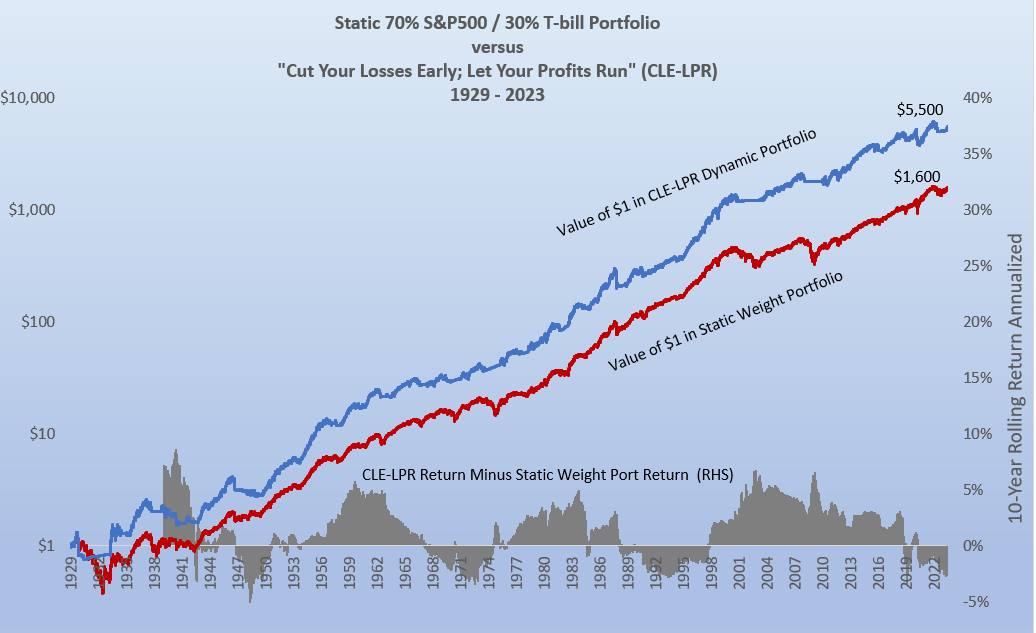
In the chart below, we see how a CLE-LPR strategy would have fared if applied to US stock market investing over roughly the past 100 years. It shows historical returns of investing in the S&P500 index with a CLE-LPR strategy versus a static weight (70% stocks/30% T-bills) portfolio of equal risk. For the dynamic strategy, we sell our S&P 500 long position and invest in T-Bills as soon as the trailing 12-month return drops below -5%, stay out of the market for at least three months, and reinstate the long as soon as the 12-month return is better than -5%.
This approach means losses are cut early, while a profitable position is held as long as it keeps going up. The CLE-LPR strategy generated a 1.4% higher annual return over the period with the same risk measured as standard deviation of daily returns, and roughly the same average exposure to the stock market of 70%.4 This translates into a 25% higher Sharpe Ratio for the dynamic strategy than for the static stock/T-bill portfolio (0.53 vs. 0.43).
Also, the Cut-Losses-Early-and-Let-Profits-Run strategy outperformed the static portfolio during the two worst market sell-offs in 1929-32 and 2007-09, when the static portfolio’s max drawdowns were 70% and 41% respectively, while the CLE-LPR’s largest drops during the same crises were 42% and 21%.
Why Does Cut-Losses-Early-and-Let-Profits-Run Work?
One way to answer this question might be to notice that this investment approach is very similar to momentum-based investing,5 which has been very successful over a wide range of asset markets and time periods. For example, in “Time Series Momentum” (2012), Moskowitz et al. found “… significant time series momentum in equity index, currency, commodity, and bond futures for each of the 58 liquid instruments we consider.”6 Over the period of our simulation, a momentum signal based on the past year of stock market performance would have lined up with the positioning from the CLE-LPR strategy 94% of the time.
Of course, pointing out that CLE-LPR is very similar to momentum investing doesn’t really answer the question, it just reformulates it into: “Why do momentum strategies work?” It’s hard to know for sure, but there are many theories to choose from. They range from underreaction to new information, to overreliance on recent returns in forming expectations of future returns (a.k.a “return chasing”), to slow recognition of regime shifts in markets, just to name a few. In most markets, positive momentum is usually associated with periods of lower risk, which in turn may encourage investors to want to own more of that asset, thus increasing the price.7 Whatever the reason, there is little doubt that momentum in asset prices has been present for a long time, across a wide range of traded assets.
Why Some Hedge Fund Managers Love CLE-LPR
Imagine you run a hedge fund and your job is to allocate capital to a set of traders. To keep things simple, let’s assume you’re managing just one trader, and he tells you that he can generate $2 of profit for every $1 of risk he takes on an annual basis.8 That is, he is telling you that the distribution of his trading PnL has a Sharpe Ratio of 2.
You feel that the biggest loss your investors will tolerate is about 10% in a given year, so you want to make sure there’s a very low probability that your Fund loses more than 10%. You’re considering two ways of managing your trader.
Under the first, you tell him that his risk, measured in annual standard deviation of returns, can be no higher than 10% of the Fund’s capital. If his trading has a Sharpe Ratio of 2, you reason that the probability of losing 10% at some point during the year is about 1.3%, which you feel is tolerable.
Under the second regime, you tell him that he should take risk in proportion to how far away he is from losing 10% of the Fund’s capital. To begin with, when he’s 10% away, he can take 10% risk. Later on, if he’s made 5% profits, and so he’s 15% away – he can take 15% risk. If he’s close to losing 10%, then he has to have cut his positions down close to zero. This pattern of position sizing is the embodiment of “cut your losses early and let your profits run.”9
Let’s compare the implications of these two ways of managing the trader’s risk-taking. Under both regimes, assuming the trader believes his trading has a Sharpe Ratio of 2, he will start off running risk equal to 10% of the Fund’s capital.10 The trader under the first system will keep his risk constant at 10% of the Fund’s capital as his PnL evolves, while the trader under the CLE-LPR regime will be dramatically increasing and decreasing his risk as his trading profit and loss fluctuates over time, in proportion to how far away he is from losing 10% of the Fund’s capital.
The chart below shows the probability distribution of outcomes for the Fund’s return under the two regimes, in both cases assuming the trader’s PnL has a Sharpe Ratio of 2. We believe everyone involved – you as the hedge fund manager, the trader who works for you, and your investors – will prefer the return pattern from the CLE-LPR regime to the return pattern arising from taking constant risk.
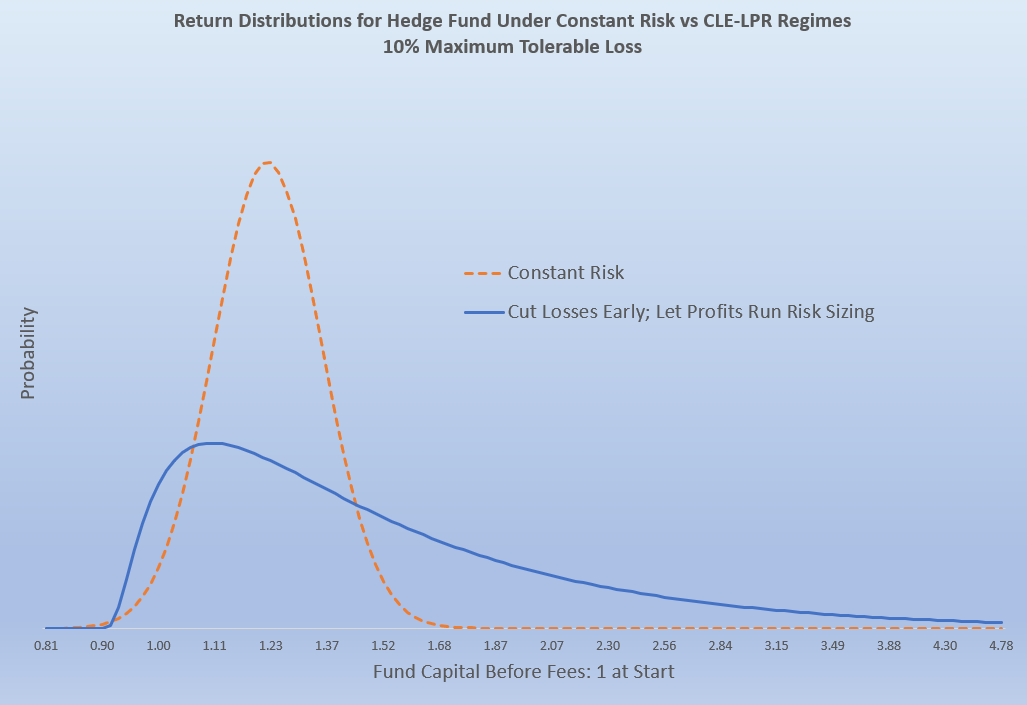
The CLE-LPR regime produces a higher expected net return (50% vs 18%),11 with only a slightly higher probability of loss (6% vs 2%) and a much higher expected fee for the hedge fund manager and trader to share (12.5% vs 4.5% of capital, assuming a 20% incentive fee). Perhaps the biggest advantage is that, if you are wrong about the skill of the trader and it turns out that his true trading Sharpe Ratio is 0, then under the constant risk regime, there’s a 1-in-3 chance of hitting -10% during the year, while the risk of a -10% return in the CLE-LPR regime remains zero, by construction.12 In addition to this being a very valuable protection for the hedge fund manager and the hedge fund investors, a trader who suspects he has little skill has a strong incentive to avoid working for a hedge fund that employs a tight CLE-LPR risk-management regime.13
Conclusion
Most people are naturally inclined to patiently, and painfully, stick with losing decisions for too long while cashing out of winning decisions too quickly. Indeed, this was an early finding in the field of behavioral economics, and was important enough to be given a name: the “Disposition Effect.”14 It is often the case that controlling our natural instincts can be rewarding. We suspect that much of the power of cutting losses quickly and letting profits run, at least when it comes to investing, lies in the difficulty of overcoming our propensity to do the exact opposite.
Further Reading and References
- Baur, DG & Dimpfl, T. (2023). “Cut Your Losses and Let Your Profits Run.” Journal of Portfolio Management (forthcoming), SSRN.
- Duckworth, A. (2017). Grit: Why Passion and Resilience are the Secrets to Success. Vermilion.
- Dybvig, PH. (1988). “Inefficient Dynamic Portfolio Strategies or How to Throw Away a Million Dollars in the Stock Market.” The Review of Financial Studies.
- Forsyth, PA, & Vetzal, KR. (2023). “Multi-period Mean Expected-Shortfall Strategies: ‘Cut Your Losses and Ride Your Gains’.” Applied Mathematical Finance, 29(5).
- Geczy, C., & Samonov, M. (2017). “Two Centuries of Multi-Asset Momentum (Equities, Bonds, Currencies, Sectors and Stocks).” SSRN.com.
- Haghani, V. (2017). Quitting is for Winners. TedX.
- Haghani, V., & McBride, S. (2016). “Return Chasing Can be Hazardous to Your Wealth.” Elm Wealth.
- Lefevre, E. (1923). Reminiscences of a Stock Operator: The Story of Jesse Livermore, Wall Street’s Legendary Investor. Cosimo Classics.
- Levitt, SD. (2021). “Heads or Tails: The Impact of a Coin Toss on Major Life Decisions and Subsequent Happiness.” The Review of Economic Studies, 88(1), 378-405.
- Moskowitz, T., Yao Hua Ooi, YH, & Pedersen, LH, (2012). Time series momentum.” Journal of Financial Economics, 104(2), 228-250.
- Shefrin, H., & Statman, M. (1985). “The Disposition to Sell Winners Too Early and Ride Losers Too Long: Theory and Evidence.” Journal of Finance, 40(3), 777-790.
- Stone, M., Michalow, D., & Beck, T. (2011 May). “Blind ambitions.” Institutional Investor Magazine.
- Kaminski, K. & Lo, A. (2014). “When do stop-loss rules stop losses?” Journal of Financial Markets 18(C), 234-254.
- This not is not an offer or solicitation to invest. Past returns are not indicative of future performance.
We thank Andy Morton and Rich Dewey for their valuable input.
- ChatGPT4 agrees: “One of the most popular sayings related to managing trading profit and loss is: ‘Cut your losses short and let your profits run.’ This phrase emphasizes the importance of having a well-defined exit strategy to limit losses when a trade goes against you and to allow winning trades to continue capturing profits.”
- A simple intuition for this result is that, in the absence of regime changes or private market forecasts, the optimal position is given by the well-known Merton Rule – and any deviation from it, via a stop-loss or another overlay, only results in the investor leaving money, or more accurately, ‘expected risk-adjusted return’ on the table.
- Ignoring transaction costs. The t-stat of the excess return is 1.3, which represents a confidence level of 90%.
- Time series momentum is a phenomenon where assets that have exhibited strong (poor) past performance over a certain time period, usually six months to one year, tend to continue performing well (poorly) in the near future.
- Also see: Geczy and Samonov,. (2017). “Two Centuries of Multi-Asset Momentum: (Equities, Bonds, Currencies, Commodities, Sectors and Stocks).”
- This explanation doesn’t fit so well in the case of momentum in bond prices. Bonds tend to be more volatile in a financial crisis, when bond price momentum tends to be positive.
- We’re making further idealistic assumptions that the return distribution of the trader is normally distributed and that trading takes place continuously with no transaction costs. We are also assuming the risk-free interest rate is 0, and the fund charges no management fee.
- This risk-taking approach would naturally arise if the trader were trying to maximize his Expected Utility, with a Constant Relative Risk Aversion Utility function taking his buffer capital as his wealth. With the numbers in this example, the implied coefficient of risk aversion would be 2, a typical value in the personal investing context.
- We’re also assuming his personal risk aversion is low enough that he’ll be happy using his full risk budget.
- This may seem like a strange and surprising result – in fact, we haven’t seen it written about before. Under the two regimes, the starting risk and hence position is the same, but over time the trading is different. There will be a larger expected position size under the CLE-LPR regime, and hence a higher expected gain.
- And with the assumption that the positions of the trader are perfectly liquid.
- The annual expected P&L of a strategy assuming optimal risk allocation is proportional to the square of the Sharpe Ratio since, from Merton’s analysis, a better trader is both comfortable with taking more risk and expects to earn a higher return on each unit of risk he takes. The formula is Expected P&L at Optimal Risk = Capital * SR2 / risk-aversion. With this rule of thumb, the hedge fund manager can select risk allocation parameters such that potential earnings for a high SR trader considering joining the fund just exceed compensation from alternative jobs.
- See Shefrin and Statman’s 1985 paper, “The Disposition to Sell Winners Too Early and Ride Losers Too Long: Theory and Evidence.”