July 2023 Investor Call Q&A with Victor & James
By Victor Haghani and James White
Thank you to all our Elm investors who joined us for our mid-year call. If you’d like to watch or listen to the full recordings, you can find them here:
Elm Investor Calls
James White:
So, we wanted to start with a quick review of the first half of the year.
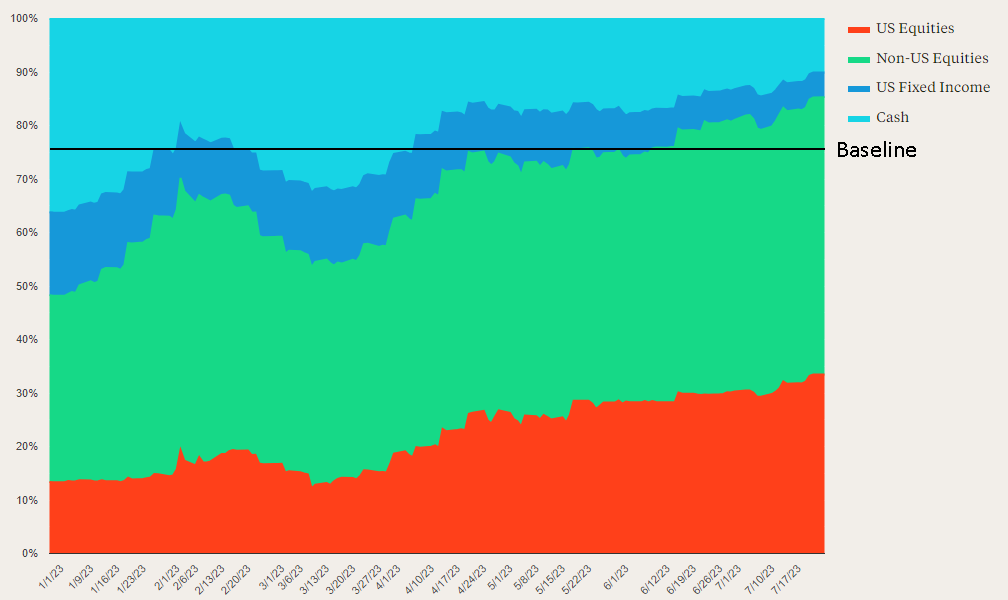
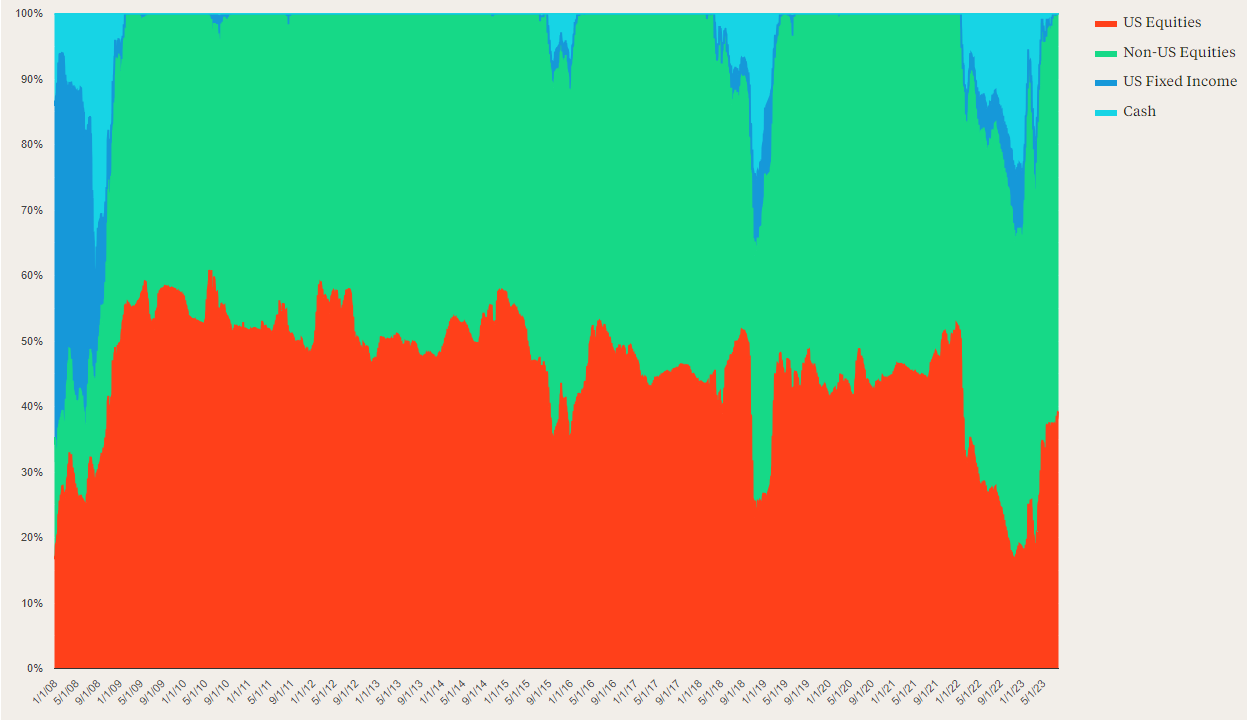
This is the asset allocation of the first half of the year, where the blue colors are fixed income and cash. You can see we went into the year significantly underweight equities, at about 50% global equities on the back of 2022, when risk premia compressed and momentum was negative across every global equity market.
The main thing that changed in 2023 is that momentum flipped again in every major global equity market, with the exception of US and international real estate. Basically, for everything else, momentum flipped positive, and as that happened – first in Europe, then the US, then the rest of the world – our asset allocation went from significantly underweight to pretty neutral and now just a little bit overweight as real risk premia remains really healthy outside the US, momentum’s positive – and then in the US, a more neutral position where risk premia are pretty tight but momentum is also very positive.
Putting this asset allocation in the context of a slightly longer period, this is what it’s looked like since the COVID and post-COVID period:
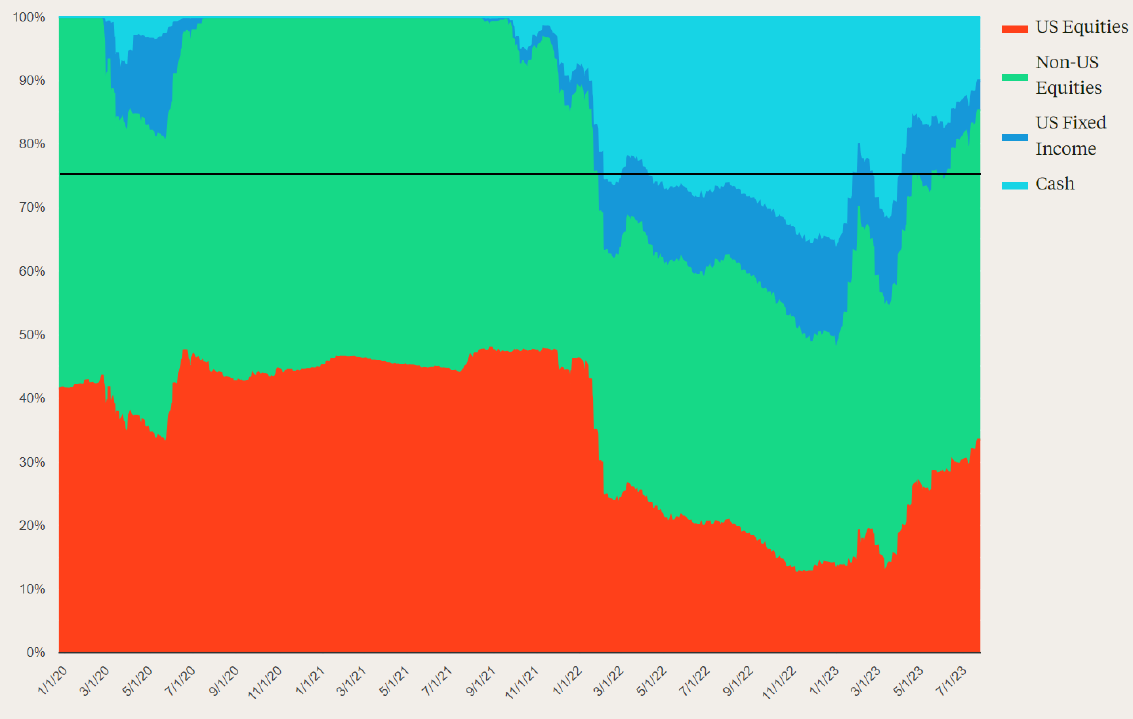
This starts in December ’19, then we were really max long equities from May ’20 through October ’21 or so. This period from October ’21 through October of ’22, as we were de-risking, was really driven both by momentum flipping negative and by risk premia compressing everywhere as TIPs yields move from -1.5 to +1.5.
This is what returns have looked like over the first half of the year so far:
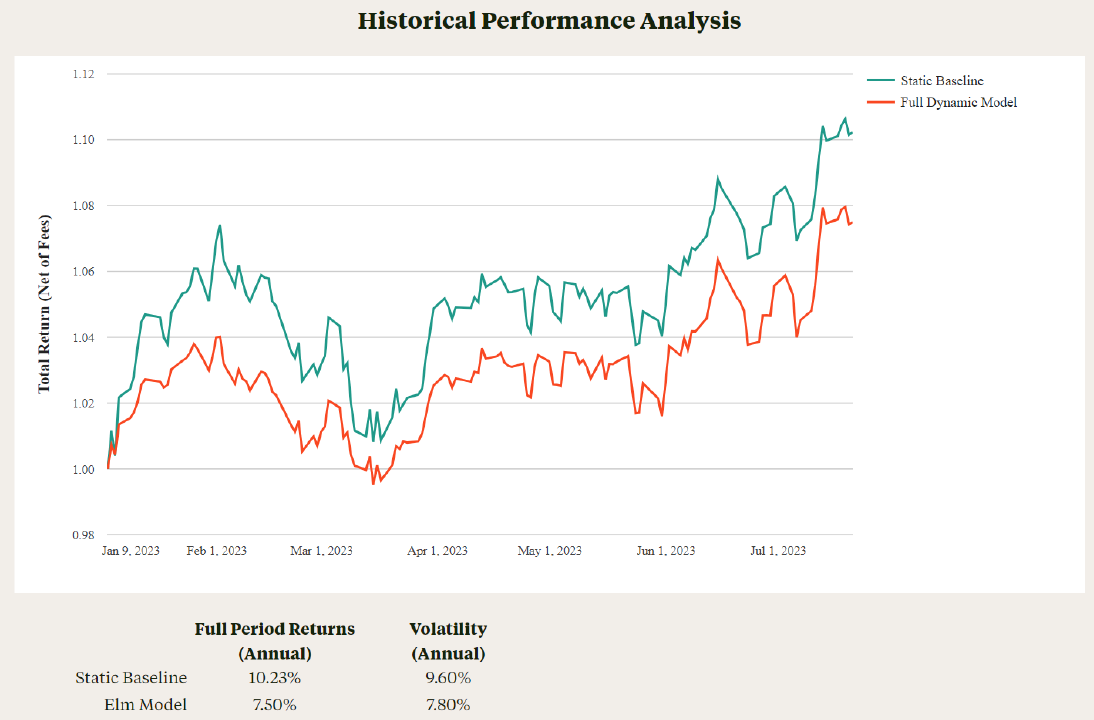
It’s been a period of material underperformance for us – relative to the static baseline, about 275 basis points of absolute underperformance, about 75 basis points of vol-adjusted underperformance. As you can see, we had low returns, but also with materially lower volatility. A number of people have asked us over this period if the underperformance worries us – it doesn’t. We are never happy to see underperformance, but we do expect it, and it would really only worry us if the character of it is something that we wouldn’t expect in either quality or magnitude.
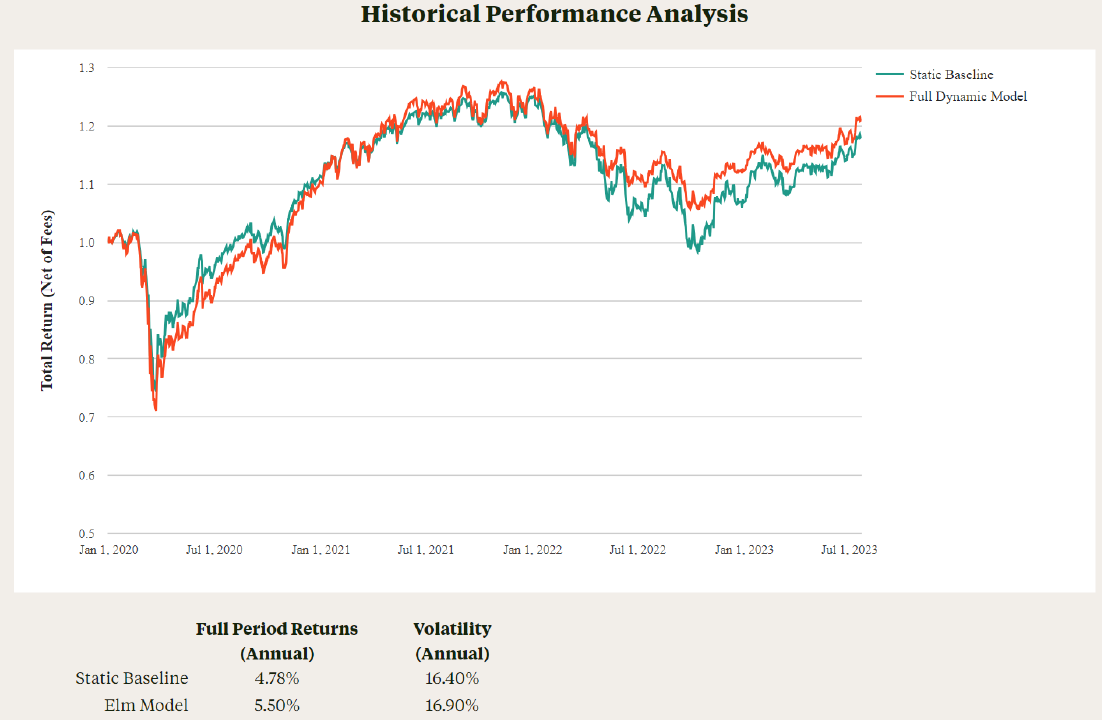
The theory behind Elm and our expectations for Elm are not that we’ll outperform in most environments for most periods, and certainly not in every environment or every period. Rather, there’ll be a fair amount of outperformance, a fair amount of underperformance – but over time, the outperformance will dominate the underperformance, and indeed, that’s what we’ve seen happen. Zooming out to the COVID and post-COVID period, there have been a couple periods of underperformance and several periods of outperformance, but outperformance has dominated the underperformance over this period by about 72 basis points of annualized outperformance.
Another question related to what’s happened over the course of this year that we’ve gotten a fair amount is what the strategy is doing to respond to the Fed cycle, to very significant changes in short-term interest rates, and to the dramatic inflation dynamics we’ve seen. The answer is that Elm doesn’t respond directly to short-term interest rates, long-term nominal interest rates or inflation dynamics. Rather, all of those things get wrapped up in long-term real yields (and we use the 10-year TIPs real yield as a proxy for the long-term real risk-free rate in general) and it’s that long-term risk-free rate that we respond to through its involvement in the equity risk premium. The equity risk premium is the expected real return of equities in excess of the long-term risk-free rate. Almost all of the equity assets we hold are long-term real assets, and so we think it’s appropriate to compare them in thinking about risk premium to a long-term real risk-free rate. It’s the ten-year TIPs real yield that is the interest rate that we really look at, and this shows its history over the last five years:
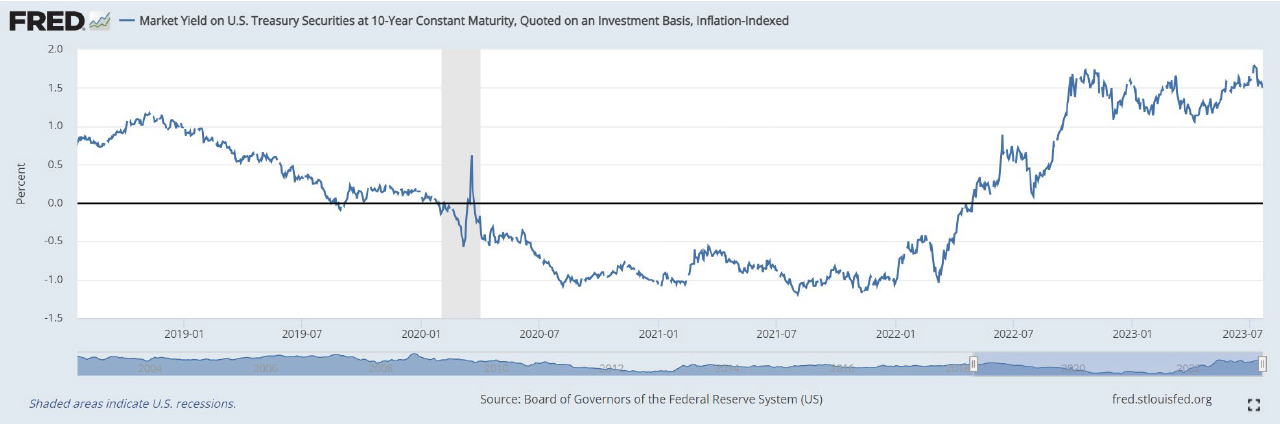
As you can see, while there was an extremely dramatic move from the beginning to the end of 2022; over the course of 2023 so far, it’s really been very quiet. It’s just been bouncing right around 1.5% – in terms of the interest rate dynamics that we focus on, it’s been very quiet so far this year though it was very dynamic last year.
Victor Haghani:
I’m going to talk a little bit about international diversification, but before I do that, just following up on what James was saying: thinking about performance and these past two years, I’m really quite happy with how the Elm portfolios have navigated this move in interest rates from -1% on TIPs or basically close to 0% on nominal rates, to over 250 basis points higher with TIPs trading at 1.6%.
Going back two years to July of 2021, the performance of our clients’ portfolios over that period is about unchanged in nominal terms: it went down and then back up again, so roughly zero return over the last 24 months. But here we are today, in an environment where we have a real interest rate of 1.6% instead of the -1% back then – and actually, the earnings yield on the global stock market portfolio (US plus non-US) is substantially higher. Somehow, we got from two years ago to today without losing value in portfolios, but we’re now sitting in an environment that has much higher perspective expected return. We thought about just taking the expected return of our baseline portfolio – two years ago, you had a -1% on TIPs, plus take 75% of equity risk premia at that time (which was about 75% to 5%) – that was an expected return on a portfolio without thinking about changing asset allocation of under 3%. And today, when we do that calculation, we’re over 4%. We’ve gone from 2.8% to 4.3%. Normally, you get higher expected returns on your portfolio after you lose money, when the value has gone down and hopefully cash flow as expected in the future hasn’t gone down as much. That’s something I feel good about, and it’s just nice sitting here today in a much more normalized investment environment with interest rates giving us some positive real rate and global risk premia being reasonable, even though the US is very tight. Anyway, I just wanted to finish what James was saying in terms of the portfolio, where we are and all of that to bring it to today.
What I wanted to talk a little bit about in our prepared remarks is international diversification. Most US investors, or the typical US investor, have about 85% in US equities and 15% in non-US equities – whereas at Elm, we believe in a much more diversified global approach to investing. Our baseline portfolios are more like 60% in US equities and 40% in non-US equities (which we even think that’s not enough in the baseline, but that’s what we use) which is pretty close to current market cap weights as per MSCI and Footsie. But that 40% in non-US equities is larger than most US investors have in their portfolios, and we’ve been running even more overweight than that because non-US equities have had a higher long-term expected return. They’ve been trading at a much lower price-to-earnings ratio or a much higher earnings yield pretty much over the past 10 years – but the US has massively outperformed non-US equity markets. Going back over the past 30 years, US equities have outperformed non-US equities by 3.5% per year, and the last 10 years was over 6%.
So, a lot of people really questioned the whole idea of investing in non-US equities – one investor wrote to us and said, “Would it not make sense for Elm to be overweight US equities? Because it seems that our entrepreneurial spirit, educational institutions, laws, lax regulation, robust labor markets, demographics, access to capital, etcetera, will continue feeding our tech companies and allow us to outperform the rest of the world and our equity market.” And we wanted to address that.
In our last quarterly letter, we pointed you all to this excellent research note by the researchers at AQR, and they wrote a piece called, “International Diversification: Still Not Crazy After All These Years” where they really covered a lot of the different aspects of this question of, “does international diversification make sense?” I think they missed one thing that I’m going to bring up at the end, but their points were really well articulated – and we were actually surprised by one of their points that they made, which we went back and looked at our own data to verify. I think the main point that that we like the most from their paper addresses this question from our investor, which is like, “Well gosh, isn’t the US just a place where companies can grow earnings much faster than in the rest of the world because the US is a much better business environment in all these different ways?” and what’s really remarkable is that the last 30 years of US outperformance was driven almost entirely by a change in valuation ratios rather than faster US earnings growth.
Going back to 30 years ago, the price earnings multiple in the US was 20 and non-US was higher at 25. Non-US companies were trading at a higher multiple or a lower earnings yield 30 years ago – today, the price to earnings ratio in the US is two times higher than the weighted price-to-earnings ratio in the rest of the world. The earnings yield in the rest of the world went from 75% of the US earnings yield 30 years ago to twice as high today, and taking that by itself explains just under 3% of the 3.5% outperformance of US equities versus the rest of the world, and another part of that outperformance can also be explained by the real appreciation of the dollar – so this story of faster US earnings growth just isn’t the story of the last 30 years. Now, maybe it’s going to come over the next 30 years, we don’t know – but, to the extent that it hasn’t happened over the past 30 years with all the different technological advances, et cetera, I think it’s a really important thing to bear in mind in terms of this thesis that somehow, the US is able to grow earnings much faster, all else equal versus the rest of the world.
The other thing that I wanted to add to this that AQR didn’t discuss: many of you have heard that Warren Buffett and others suggest that people just invest in the S&P 500. That’s all you need to do because, after all, so many US companies derive so much of their earnings from international markets that you don’t need international diversification – just invest in the S&P 500 and you’re going to get all of these foreign earnings, profits that are derived from foreign markets without having to invest in foreign companies. Well, it’s true that just over 30% of US earnings and revenues of the S&P 500 come from international operations, but what people don’t talk about (which is a really interesting point) is that if you’re buying those earnings via the S&P 500, you’re buying those earnings at a price-to-earnings multiple of the S&P 500 – whereas if you buy them directly by owning non-US equities, you’re getting them at half-price, you’re getting them at the price-to-earnings multiple of non-US equities. When you think about it like that and you think about US equities, you say, “Well, if I’m going to price their international revenue using the price-to-earnings ratio of non-US equities, then the US earnings that I’m buying are at an even higher multiple than they seem to be with it all blended together.”
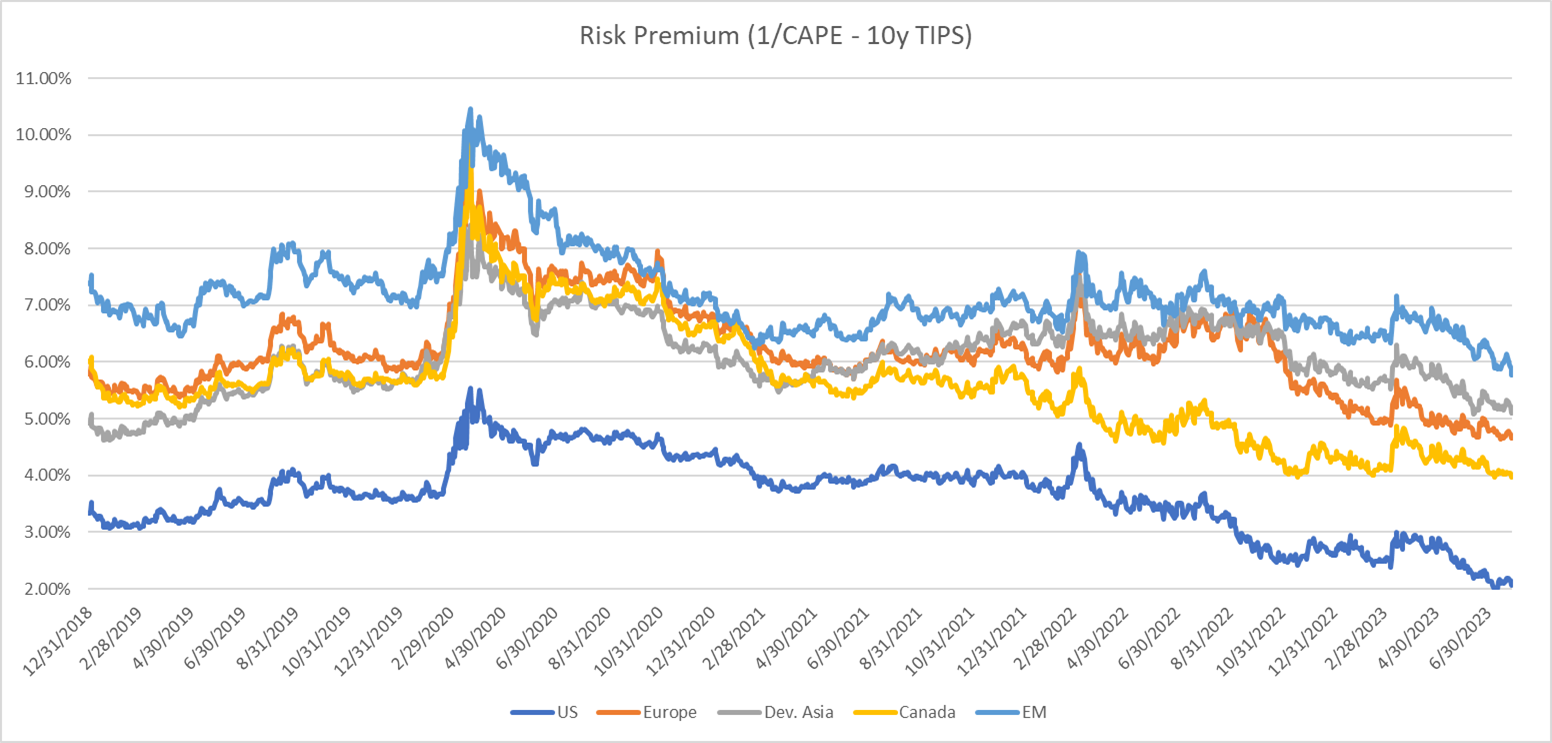
Anyway, I just wanted to talk a little bit about this international diversification. When we think about the earnings yield of these broad markets minus the real rate on the safe asset of TIPs, we’re seeing something really dramatic right now. US equities are giving us an extra 2% long-term expected return relative to TIPs, whereas the non-US market is giving us over 5% extra long-term expected return over TIPs – and that’s a really dramatic relative relationship. That’s why, when you look at our asset allocation, we’re somewhat underweight US equities right now and fairly dramatically overweight non-US equities. That’s really where it’s primarily coming from since we’re in this lower risk environment with positive momentum across the board, but those long-term valuation expected returns are really dramatically different.
JW:
So, I’m going to say a few brief words about something we talked about in our quarterly letter, which is the upcoming changes to the Elm Global Balanced strategy. Over the years, our strategy offerings have expanded a bit – right now, we have a Global Balanced strategy in taxable format, non-taxable format, US/UK format, All-Equity strategies in the same, sector options – it’s become a slightly unwieldy collection of strategies. Both in the interests of simplifying all that and in the interests of accommodating clients who have needs beyond what those two default strategies can offer, we’re consolidating everything into one Elm Global Balanced strategy, which clients can customize the baseline through two dials they can set. One, which will basically set the risk level of the strategy through the baseline equity allocation, and the other which can set the amount of the mix of US versus non-US equities. I’m not going to go into too much depth on it right now – we’ll be sending out a much more detailed note in the coming weeks about the strategy – but I just wanted to reprise what we mentioned in the quarterly letter about it. This is really driven partly by a desire to simplify everything, partly by having a much more sophisticated technology platform now than we did five or six years ago and the ability to do it, partly by the financial planning and portfolio choice work we’ve been doing with an increasing number of clients, and wanting to have a baseline and a product that we could offer our clients as a result of that portfolio choice work that would be appropriate for them.
One of the questions we got about this is whether there’d be an option to set the baseline at 100% equities, and there will be such an option.
With the new Global Balanced strategy, if you set the risk dial to 100%, basically that means the baseline will have 100% equities. And then, whenever the dynamic allocation wants to be overweight, it’ll just stay at 100%; whenever it wants to be underweight, it’ll go underweight. As you can see, over the last 15-plus years, it’s mostly stayed at 100% with a few significant excursions away from it. Our guess is that most of our clients in the current All Equity strategy will be interested in moving to this setting. We’re not forcing anyone to, but our guess is that this will be a more appealing strategy for our All Equity clients. There’s still a number of details that we’re still working out in terms of the flex strategy, I hope we’ll answer a lot more questions when we send out a detailed note in in the coming weeks – but feel free to reach out to us any time to talk more about it.
VH:
I want to talk about another new product that we have in development. Whereas what James talked about is ready right now, we’ve also been working on a direct indexing tax-loss harvesting offering, too. We’ve been working on that for quite some time, we’re in live testing right now, we have a portfolio that we’re running with it. The idea here is that a client opens a separately managed account, we get that account invested in an index like the Bloomberg 500 (we think it’s a slightly better index) and that you own every stock in that index in its market cap weight, we try to manage close to that index, but realizing capital losses where we can and trying to manage the risk of that (realize the loss, wait for over 30 days in terms of wash sale rules, replace, rebalance the portfolio, et cetera). We have different settings for it – if somebody really would like to generate short-term losses over time and doesn’t mind getting long-term capital gains offsetting that (sort of generating as much total capital loss as possible, but with an idea of generating short-term losses versus some long-term gains), we can do that, or we can just set it to only looking to generate capital losses. We expect that we’ll be able to customize it – so somebody has an appreciated holding of, say, Apple stock that we could create a portfolio that wouldn’t have Apple or wouldn’t have tech stocks in it potentially.
It’s getting close: we know we’re going to do it, that’s why we’re talking about it now, we want to let you know about it, we want to start having some conversations – the different aspects of the structure in terms of fees, in terms of how integrated it might be in our Global Balanced strategies, all of those things are yet to be determined, but we’re going to have a simple US index-based product up and running and available for everybody pretty soon. Feel free to be in touch with us about that, we think that we’ve developed a good version of this compared to other things out there and we’re pretty sure that whatever fee we choose on this is going to be substantially below the fees that we see from people who have been providing this elsewhere. So stay tuned!
JW:
Another development we’re really excited about is that, well, some of you probably know we’ve been working on a book for the last several years called The Missing Billionaires. Feels like it’s been for several decades sometimes, but it’s really only been for a few years now. We’re very pleased that, just a couple of weeks ago, we signed off on the final proofs for the book – it’ll be available in early September! All of our investors will be receiving two copies from us, so no need to rush out and buy it. We will also be doing an investor call, like this, just to talk about the book. It’ll be a fun forum to talk about it with everybody, and we also expect to do a book launch event, at least one in New York and one in London. Those haven’t been scheduled yet; we’ll keep everyone abreast of the details.
VH:
We’re super excited. We’re excited to send out copies to everybody, but you can also buy it on Amazon. Our intention is to send out two copies, one for you and one to give away if you like it.
OK. So, into the Q&A – the first question is really interesting. Somebody was asking us, “How can you think of TIPs, of inflation-protected treasury bonds as being an inflation head when the price of TIPs went down as we got this whole inflation surge over the last couple of years?” This morning, I was talking with one of our investors and he was explaining that, years ago, he had bought government savings bonds that were indexed to inflation and at a nice, relatively high yield and was really happy about it. It was giving him this inflation-adjusted cash flow over time and he never even thought about the fact that, if they had a price (which they don’t have because they’re not traded on the market) it would have gone down over the last couple of years as real rates went from -1% to 2% on these bonds to +1% or 2% on the bond. The value of his portfolio, of the savings bonds would have gone down a lot, but since he doesn’t see a price anywhere, he didn’t think about that – he thought about them as being a nice head of the real income value equivalent of his wealth. I think that the answer to the question of, “how can you think that TIPs are an inflation hedge when their price goes down when we get a surge in inflation?” – the reason the price tends to go down is, we get a surge in inflation, the feds start hiking interest rates. Real rates go up, and so the value of these bonds goes down – even though their cash flows remain inflation index for us.
I think the answer to that question of, “How can they be an inflation head?” really gets to the heart of this question of, “What is it that we’re trying to protect?” Are we trying to protect the inflation-adjusted value of our wealth as per our brokerage accounts today, or (what we think makes more sense) is it we’re trying to protect the real consumption, the real spending that our wealth can generate potentially over our lifetimes and future generations’ lifetimes as well? In that sense, TIPs are a good hedge if we’re thinking about hedging out the real income equivalent of our wealth – but they’re not a good hedge if we’re trying to have the value of our portfolio today (as per our brokerage accounts) stay constant in inflation-adjusted terms.
I thought it was a really great question and topic, and it doesn’t really have a right or wrong answer; it just depends on what it is that you really want to be protecting, and if you are protecting what we think makes a little bit more sense (which is this long-term real income stream), it’s nice that TIPs actually gives you that protection. If you’re trying to protect the real value of your portfolio today, that’s a really tough problem; there’s not a lot of great suggestions for how to do that. Maybe running a position short nominal bonds or something like that might help a lot of the time, but there’s nothing that’s really going to do that too perfectly right now.
JW:
Another question we had from several people was: especially in this year of such dramatic sector performance differentials – in the US, at least – why at Elm, we don’t apply our methodology down to the sector level. First, let me say we do have a strategy option which will persist in our new Global Balanced consolidation where we can take the US equity market and, instead of expressing that through one broad ETF like VTI, we break it up into all of the sector funds and own all of the sector funds. However, we do that not because we think it improves anything about returns, but because it improves tax loss harvesting. There’s more sector dispersion than broad market dispersion. So, if you break up the market and all of the sectors, you get more expected tax loss harvesting – and then once we add a direct indexed option, you’d get still more if, instead of breaking up into the sectors, you break it up into each of the individual stock constituents. We already do have a sector option, really for tax loss harvesting, where the cost benefit of that is you get more expected harvesting but at the cost of a more complex account – double the names, more trading, etc.
The reason why we don’t apply the full Elm dynamics at the sector level is that we don’t believe that, at the sector level, the risk premium is as meaningful as it is at the broad market level. One of the big ideas behind why cyclically adjusted earnings yield is a decent forecaster of the long-term real return of equities is that, in the big picture, total market earnings are somewhat bond-like. They’re not totally bond-like, they have volatility, but they have significantly less volatility than the overall equity market. And so, if you basically take cyclically adjusted earnings divided by price and those earnings are somewhat bond-like, that gives you a decent forecaster of expected return. As you get away from broad economic aggregates towards the sectors, and then even further towards individual companies, earnings become less and less bond-like. Obviously, at the level of an individual company, earnings can be extremely volatile – and even at the sector level, there’s so much volatility in earnings and variation across the sectors that the methodology we use, which we apply at the broad market level, just doesn’t work as well.
VH:
So, some people just wanted to ask us about the NASDAQ rebalancing. I don’t know how many of you have heard about this, but the NASDAQ index of technology stock has this built-in rebalancing mechanism where, when the top companies become too large, they cut the weights of those companies – Apple and Microsoft being the two biggest ones there – and then they come up with these new weights. Anybody that’s following that index, and in particular, the ETFs that are indexed to the NASDAQ 100 Index, have to do trades in the marketplace to get back to the index weights. Matt Levine from Bloomberg touched on this and sort of pointed out that the way that NASDAQ talks about it, at least superficially, that it was going to have a pretty perverse result where Meta was going to wind up getting an increase in weight in the index because it was just under the threshold that they had – I think of 4.8% of the index – but NASDAQ sort of made it more sensible and they are cutting the weights of the top five or so of the index constituents.
It doesn’t really have an impact on what we do at Elm, it doesn’t have an impact on any of the ETFs that we use as part of our portfolios at Elm – but it was kind of an interesting case. And of course, it just brings up this question that people ask, “Are market cap weighted indexes getting too concentrated in the top names?” By the way, there are similar rules built into some other ETFs – so in some of the sector ETFs, there could be reweighting of the constituents down the road. Right now, the NASDAQ 100 is the only one doing it, but some of the other indexes might do it – like the technology index in the SPDR, or the S&P Technology index, which is what State Street indexes their ETFs with.
On the question of, “Are these stocks too big within the index?” We wrote about that maybe six months ago – maybe it was a little bit on the technical side. We were talking about, given that Apple or Microsoft are about 3.5% to 4% of the global stock market index – just how big is that? How much extra return should they need to earn because they’re so big and their risk is not being fully diversified away in the global index? What we found and talked about in that paper was that the effect is not very big, that being 4% of the global index doesn’t seem like that’s such a big weight. When you think about these companies, they have a lot of activities going on in the companies, right? Microsoft has got some big software business; they also have really big web and cloud computing businesses. So anyway, we’re not too concerned about these weights. Historically, it’s not really unprecedented at all. I mean, there have been times when there’s been quite a lot of concentration. If the concentration were smaller, it would be more comfortable for us – for everybody – if the return of the market was more broadly distributed, but it’s just the nature of equity markets that most of the return comes from a very small number of stocks. That’s just how markets have always been: going way back, we can see that the value creation and stock market comes mostly from a relatively small number of stocks. So, we don’t think that we’re in unprecedented times – it’s a little bit uncomfortable, but it’s not something that’s keeping us up at night. And the NASDAQ rebalance was very interesting and also shed some light on just this question of concentration in general.
JW:
I see Ravi as his hand raised, shall we take that question?
Ravi Mattu:
I just had a comment on the global equity risk premium versus the US equity risk premium. I sort of agree with your comments that you don’t probably want to rely on equity risk premium measure at the sector level, but I think a large part of the discrepancy in equity risk premium between the US and the rest of the world comes from the sector composition. And you probably have a value tilt anyway, you’re probably tilting towards value a little more – for example, the tech sector is a big part of the US indices if you disaggregate down by sector large companies with an energy consumer staples, big pharma, autos, the global industries. It doesn’t look like the ERP is that different between top-notch US companies and top global companies listed in the rest of the world. I think it’s all good, it gets down to difference in sector composition, which may be fine to tilt towards value but to do that twice over – in other words, have a tilt towards value within the US, and then do it again. I agree with your comments about global diversification, there may be all kinds of other good reasons to diversify, including people are tagged to domestic indices and there are flows in and out of equities, risk assets driven by local dynamics. So, I agree with the general concept of global diversification, I just think that the valuation tilt towards the global stuff might be overdone because of this sector difference.
JW:
It’s a little bit dated now, but in 2019, we took a look at that, actually.
RM:
We had done that back in our time with Bitcoin; we didn’t find any difference outside of the sector difference.
JW:
So, we actually wrote a paper called “Do US Industry Sector Weights Explain the Higher Valuation of US versus Non-US Equities?” It was something a client had asked us about, and at least in August of ’19, we found that we didn’t find the valuation differences as being explainable by different sector concentrations. I’ll send you the paper, but it’s a few years old now.
RM:
There’s nothing like Apple, Microsoft, Google, Meta in the rest of the world, so you have to take that out when you make this comparison.
JW:
Yeah – Apple for instance. Those aren’t the companies that are – it’s not trading at a crazy valuation either.
RM:
And the other question was: hasn’t your equity risk premium measure gone down quite a bit with this big swing in real rates from -1 to +1.5?
JW:
Yeah, it certainly has. I’ll include a chart of equity risk premium by market:
RM:
So it’s momentum that’s keeping you in equities.
JW:
Yeah – momentum and the fact that outside the US, even though equity risk premiums have contracted, they’re still quite healthy. They contracted from high low, for instance, and they went from an average of 7% to an average of 5% or something.
RM:
But Victor was saying that the CAPE earnings yield has actually gone up.
VH:
From two years ago, the earnings yield has actually gone up overall.
RM:
And that is the CAPE, not the spot.
VH:
Using the last 10 years or so. Basically, from two years ago in our numbers, the earnings are a bit higher and some of the markets are actually lower – the US is higher, but other markets are lower. So, the earnings yield of the whole equity market is a bit higher over the last two years, the risk premium is a bit lower because of the change in the risk-free rate, and the expected return on the portfolio is a lot higher. But the nice thing is the expected return on our investment portfolios are much higher today than they were two years ago.
JW:
The next question says, “Going back to the Warren Buffett comment earlier – the S&P 500 has outperformed the Elm Global Balanced strategy over the past five years. What are your thoughts? Do you expect market conditions to change and be more favorable to the Elm strategy?”
First, let me say – I think market conditions have been favorable to the Elm strategy over the last five years. We don’t regard the S&P 500 as a benchmark for the strategy. It’s not trying to be S&P 500 or compared to the S&P 500 in any way for a variety of reasons. The Global Balanced strategy has a baseline of 75% equities, 25% cash and bonds – that’s not because we think 75/25 is going to have better returns, it’s because we think, for most investors with normal risk aversion, being fully invested in equities is not the right risk level. There are non-return reasons to want a lower allocation than 100% equities, and similarly, I think about global diversification and diversification in general primarily in risk terms rather than in return terms. I think Buffett also said that, if everything in your portfolio is doing great, you’re not diversified.
One big decision we made about Elm is that we want this to be a strategy that is appropriate for very large fractions of people’s wealth. It’s essentially all of our wealth for me and Victor, we have many other clients for whom it’s a very large fraction of wealth (and others for whom it’s a smaller fraction), but we want it to be appropriate for large fractions of wealth. One thing that means is we want it to be really highly diversified and there are a range of investment choices that can’t just be made on the basis of returns. For instance, over almost any period you look at, Apple is going to have better return metrics than the S&P – higher returns, higher Sharpe ratio. Based on almost any standard investment metric, you could say, “Why invest in the S&P? Why not just invest in Apple?” Over almost every period, Apple has beaten the S&P. Yet at the same time, I think people recognize that owning the S&P is, in some sense, lower risk than owning Apple – that it has a diversification benefit that doesn’t necessarily show up in any particular sample of data over five years or ten years or whatever, and that argument holds all the way up.
We don’t have any particular view about which global equity markets are going to outperform over the next year or a few years. We do look at risk premia, which tell us that US equity risk premia are much lower than non-US equity risk premia – which, statistically at least, suggests lower expected excess returns for US equities versus non-US equities over a long horizon. Over the medium-term, we don’t have any particular view – we think it’s very hard to have a view about which equity markets will outperform going forward. Historically, it’s not been very consistent, just because one equity market outperforms for a decade or so, then it flips and another equity market outperforms for the next decade, and that difficulty in figuring out which equity market is going to do the best over the next period is one of the arguments for global diversification. They’re not the only one.
VH:
I think the biggest question facing investors these days is this US exceptionalism and trying to understand it and trying to respond to it. It’s very natural to see this outperformance – one decade is a long time, let alone three decades – and to start explaining that it will always be this way. Well, first of all, if it were correct to have expectations that the US would outperform the rest of the world by 2% a year, we would have to say that markets are being pretty inefficient, right? That would not be an efficient solution, that would not be consistent with an efficient market. So that’s one place to start and to think about it – another thing that we haven’t talked about or written about in the past is just trying to understand why have we seen this incredible US outperformance? As we said earlier, that primarily it’s coming from a change in valuation and not from a change in earnings growth, it comes from people rating US equities higher relative to the rest of the world – and dramatically so over the last long period of time.
But why are people doing that? Well, people might be doing that because they just think that the US is going to have much higher earnings growth in the future, and so it deserves a much lower multiple – as Ravi was saying, maybe the US just has very different companies in terms of sectors and characteristics than the rest of the world. That’s possible, but other possibilities are that US companies are buying back about $1½ trillion or more of their own stock per year, and the rest of the world is basically doing zero of that (as far as we know). So, in the US, companies are just going out there and spending $1½ trillion in the last couple of years. That’s what, 3% or 4% of the total market is just being bought back by the companies themselves, buying back their own stock with cash?
And then, of course, another aspect of it is this sort of relatively self-fulfilling loop that you get into where it’s like, “Let’s have 90% exposure to US equities.” Well, if US investors want to have 90% of their portfolios in US equities, but if the rest of the world wants to have 30% of their money in US equities, there aren’t going to be enough US equities to go around, potentially – and it’s just going to keep putting this upward pressure on equity valuations, too. There are some factors we don’t see dissipating right away, but at least it gives us some comfort that there is some understanding of what’s been going on, even if it’s going to persist. I mean, at some point, the differential in earnings yields just becomes large enough where it’s really hard to overcome that with future changes in valuation too. The earnings yield of US equities versus TIPs at 2% is pretty tight. It was actually 0, or slightly negative, about 23 years ago in 2000, and that didn’t end well. Around the year 2010, TIPs were yielding close to 4%, and equities had an earnings yield of around 4%. So viewed in this way, the expected risk premium from owning equities was zero or slightly negative, and that turned out to be a really bad time to own equities and a really good time to own TIPs. We’re not as extreme as all of that now, but we do think that there are some bounds on these types of moves.
JW:
Vijay asks, “In the All Equity portfolio, is there a floor for the US allocation – and, if so, what is it?”
There is not a formal floor. In the new Global Balanced strategy with the flexible baseline, if you set the equity dial to 100%, then over the last 15 years at least, the lowest US allocation you got was in 2007/2008, when there was about 15% US and 20% non-US. In the current All Equity strategy, which literally stays at 100% equities all the time, the lowest US allocation was about 30% – so no formal floor, but it’s really, really hard for it to ever go below about 30% from a baseline of about 55/45.
Victor, I think we’ve exhausted this group! I think we should cut it here, but if anybody thinks of questions in the coming day or two, feel free to just e-mail us.
VH:
Thank you, everybody for being on this. We love this – this is a big source of conversation for us is having these calls and seeing your faces, your names is wonderful. Thank you.
JW:
Thank you, everyone. We’ll almost certainly be doing an interim call for the book, so you won’t have to wait six months for the next one!