January 26, 2016
Investing 101
Return chasing can be hazardous to your wealth
By Victor Haghani and Samantha McBride 1
Introduction
A thriving investment manager started his presentation to a roomful of potential investors, saying:
“Before I tell you what I do, I’m going to ask and answer the most important question you should put to me: Who is losing the money that I’m going to make for you?”
“The answer: return chasers.”
At first, this sounds reasonable, at least with regard to investment returns which are not explained by risk. But then, on further reflection, one has to ask: What about trend following, arguably the best systematic investment strategy of all time? Why was he silent on what many consider the “premier anomaly?” 2 More troubling still, how can trend following have worked so well, while “return chasing,” which sounds like the same thing, be so misguided as to be the primary source of the superior returns of smart investors?
What follows is an attempt to answer that question, which may be useful both in making sense of history and thinking about the future.
Definitions of Trend-Following and Return Chasing
Fortunately, half of the problem is straightforward; trend following is pretty well-defined. Set in the context of an investor who wants to hold a baseline allocation in equities of 50%, with the other 50% in cash, a simple trend following investment strategy would be:
Trend Following: If the past one year 3 stock market return was good, say prices have gone up by more than 2.5% after inflation, hold 100% in stocks; if it was wasn’t good, hold 0% in stocks.
It’s hard to come up with a simpler strategy. And what is truly remarkable is that it’s hard to come up with one that has done better. For example, from 1975 to present, it added about 2% a year to the returns of a balanced long-only portfolio of 50% US equities and 50% T-bills, while significantly reducing risk.4 And this simple investment rule has been shown to have worked virtually everywhere and every when.5
So that’s trend following. Unfortunately, “return chasing” doesn’t have an agreed-upon definition.
While trend followers proactively follow a pre-defined set of rules, which are well-documented in the academic literature, return chasers act in a more discretionary and reactive way. Return chasers are often unaware of their behavior, creating a slower-moving, self-reinforcing herding phenomenon, based on the simple, readily available and intuitively appealing heuristic of recent past returns.
This description suggests the following definition:
Return Chasing: When the past one-year return has been good, buy some stocks, and when it’s been bad, sell some.
The key difference with trend following is that return-chasing behavior is a flow, which continues as long as returns are either good or bad, while trend followers buy as soon as the return has been good and hold until the return becomes bad, and then they sell, and don’t do anything until the return has been good again, and then they buy and hold again, etc.
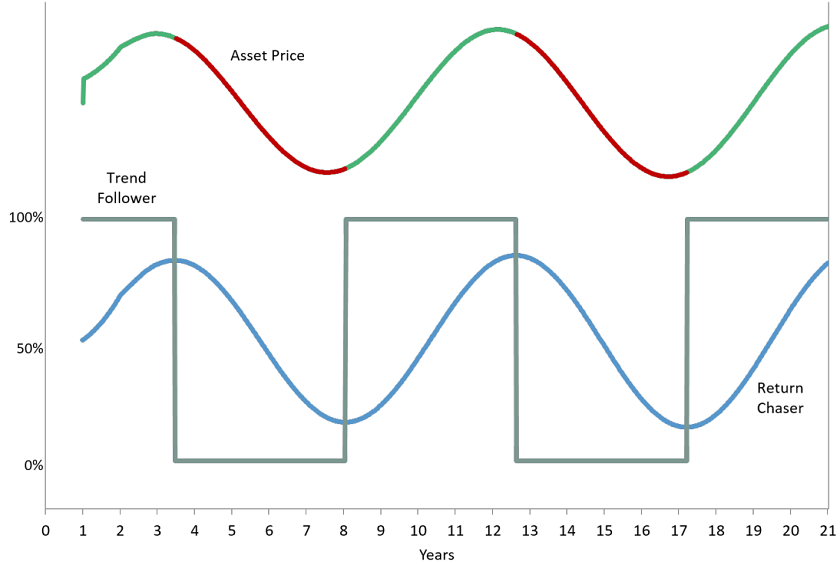
Below is a chart that compares the positioning of a return chaser and of a trend follower in the case of a very stylized cyclical asset price path with a nine year cycle. The line of the asset price is green when the last one year return is positive and red when it’s negative. If you look carefully, you can see that the sign switch (the color change) occurs shortly after the market peak or trough. Notice how the trend follower changes his allocation abruptly, capturing most of the moves up and down in the asset price, while the return chaser is slow to adjust his holdings, which results in him losing money from his dynamic positioning, as he winds up with his maximum long holding just after the market peak and his minimum holding just after the market hits bottom.
The next big question we need to ask is, do the return chasers lose money in more realistic scenarios other than this highly stylized case above? There are at least two places we can look for an answer: 1) check if they’d have lost money applying that rule historically, and 2) using a Monte Carlo simulation to see how the strategy would perform over many plausible histories.
Historical Analysis
Let’s start with a historical look at US equities. We used Professor Robert Shiller’s monthly US equity data from his website, which goes back to 1871. We compared three strategies: 1) static 50/50 Equity / T-bill portfolio, rebalanced monthly, 2) the momentum strategy as described above, and 3) a return-chasing strategy, wherein the investor increases or decreases his exposure to stocks each month by 20% of however much the past year’s real price return was in excess of 2.5%.6
The table below shows this didn’t work out very well for the return chaser, underperforming the static weight buy-and-hold investor by over 1% a year. You may be even more surprised to see how well the simple momentum strategy did, outperforming the static weight buy and hold by 2% to 3.5% a year, even though superficially it seems so similar to the return chaser. Of course, we shouldn’t expect all return chasers to be using a one-year look-back in deciding their asset allocation, but it turns out they would have also done poorly using a broad range of other look-back windows: six months and two, three, four and five years as both straight look-backs and as moving average windows. We found the same order of magnitude results in the case of the MSCI World developed index from 1975 to the present.
| 50% Equity 50% T-bills |
Return Chaser |
Momentum Investor |
|
| Real Return | |||
| 1872 – 2015 | 4.86% | 3.70% | 8.42% |
| 1925 – 2015 | 4.46% | 3.11% | 7.59% |
| 1975 – 2015 | 5.77% | 4.67% | 7.71% |
| vs. 50% Equity 50% T-bills |
|||
| 1872 – 2015 | -1.16% | 3.56% | |
| 1925 – 2015 | -1.35% | 3.13% | |
| 1975 – 2015 | -1.10% | 1.94% |
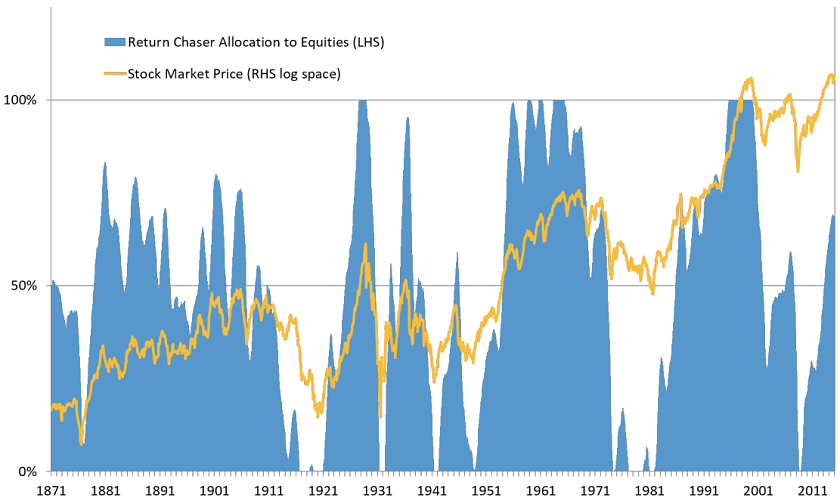
The chart below shows the return chaser’s asset allocation (the blue bars) over the whole time period, with the stock market real price performance in the orange line, off the right hand scale, in log space. The return chaser’s asset allocation chases the market, and, significantly, it tends to have its biggest exposure shortly after the top of the market and its lowest exposure shortly after the bottom.
By contrast, the momentum strategy jumps up to being over-allocated more quickly than the return chasing approach, and also gets under-allocated more quickly. One description would be that trend followers “front-run” the slower adjustment of the return chasers, giving the trend an initial boost. Ironically, the return chasers probably feel they are being prudent and wise to adjust their allocations slowly, scaling in and out of their investments as they get confirmation they’re doing the right thing, as compared to trend followers who dive in fully to their adjustments and hold until it’s time to go the other way. The trend followers are more frenetic in their activity; as configured, they have ten times higher turnover than the return chasing strategy.
The Not-So-Curious Case of Investor Returns Being Substantially Lower Than Fund Returns
Supportive, but indirect, evidence for the notion that return chasers are losing money is the finding that mutual fund investors have earned 1.5% to 3% a year lower returns than the returns of the funds they invested in.7 This is separate from the effect of fees on investor returns, which gets so much coverage in the financial press; rather, it has to do with the timing of investor flows. The effect probably comes from a combination of poor market timing and poor dynamic selection of funds themselves, putting money into funds that are hot and redeeming from those that are not. That dollar-weighted investor returns have been lower than fund returns historically has not attracted as much attention perhaps because it’s a story wherein the perpetrator and the victim are the same party: the investor.8
Monte Carlo Simulation
Let’s now turn to exploring the question through Monte Carlo simulation. We’ll assume two assets: a risky one (think equities) and a zero risk one (cash). We generate series of prices for the risky asset by starting at a price of 1, and we model the price dynamics as having three components: 1) a random weekly shock, which is normally distributed with mean of 0, and an annual standard deviation of 16%, 2) mean reversion, where the price moves back to 1 at a rate of 25% a year (or roughly 0.5% of the way each week), and 3) a price impact of the return chasers, where for every 1% change in their desired allocation to equities they move the price up or down by 0.5%. This price impact is consistent with what would need to happen to equity prices if roughly 12% of the stock market were held by return chasers who started with a 50/50 allocation between equities and cash and wanted to move to 51/49 and the other holders of equities didn’t want to sell to them.9 And, as with our historical analysis, we assume they will change their allocation each month by 20% (about 5% each week) of whatever the past one year excess return has been, with a cap of 100% and a floor of 0%. We assume no price impacts from other market participants, such as trend followers or value investors, which is a critical assumption the relaxation of which is discussed later.
In the simulation approach we again looked at three investment strategies: 1) a static 50/50 equity/cash monthly rebalanced portfolio, 2) return chaser who starts out 50/50 and 3) a trend follower who is 100% invested in either equities or cash. We assume 0 transactions costs in all these strategies. The table below shows the results for 5,000 paths of 20 year investment periods based on weekly simulated prices.
| Return Chaser |
Momentum Investor |
|
| vs. 50% Equity / 50% Cash | -2.0% | 7.3% |
| Sharpe Ratio | -0.18% | 0.62% |
As you can see, the return chasers lose money compared to the buy and hold investor, and the trend following investors make money. Interestingly, the return chaser shortfall is not too far from what we see empirically in the studies comparing dollar-weighted investor returns and fund returns. Also, it is noteworthy that the Sharpe Ratio of the return chaser at -0.18 is close enough to 0 that it would take a long time to conclude that he is following a harmful strategy. The momentum investor, on the other hand, generates a high enough Sharpe Ratio to gain confidence within say a 10-year horizon that his positive results were not just a random outcome. These results are robust to the following range of parameterizations: we doubled and halved each of the parameters describing the impact of return chasers and the coefficient of mean reversion separately and jointly, and the same pattern and order of magnitude of results held in all eight perturbed cases.10
Return Chasing: A Simple but Expensive Heuristic
Of course, this is just a guess at the nature and prevalence of return chasing strategies. It’s very difficult to figure out how many return chasers there are, as many return chasers are not even aware that they are behaving that way. In fact, we suspect there are return chasers reading this note thinking: “What a silly way to invest. There can’t be many people who do this.” Investing is a complex affair, and when faced with complexity, we rely on simple heuristics. There is no heuristic simpler or more to hand than looking at past returns. Of course, that means ignoring the most common disclaimer in investing, “past results are not necessarily indicative of future returns,” but as the saying goes, “let’s not allow facts stand in the way of a good story.”11 Even if individual investors do not move gradually in their investments, as a group they may behave that way, as herding and network effects result in some investors being the leaders (the trend followers) and others moving more slowly and hence doing worse than the average of the return chasers.
Gradualism seems like a good way to deal with uncertainty, and it reduces transactions costs, and possibly regret too. Unfortunately, what seems like a sensible approach turns out to be a very expensive one.
Explanation for Momentum
An understanding of why a strategy has worked in the past is essential in deciding whether to stick with it in times when it’s not profitable. This simple model of return chasers adds to other plausible explanations for why trend following based on momentum in asset prices in the roughly one year horizon has been so profitable and ubiquitous.12 Barberis and Shleifer (2003) and Vayanos and Woolley (2013) provide comprehensive and rich treatments of this phenomenon, relating return chasing behavior to investors using past absolute and relative returns as primary indicators of manager competence or expected future relative returns across investment styles or asset classes. Models grounded in return chasing behavior complement other popular rationales for momentum in asset prices such as anchoring (under-reaction) and herding (over-reaction).
Another suggestion for a definition of return chasing is that it is the pursuit of trend following rules with too long of a horizon. While this may explain how prices move away from fair value and create opportunities to benefit from long term mean reversion in asset prices, it has two shortcomings in accounting for momentum. First, we need to show that it loses money, but in fact, trend-following in US equities using a two-, three- or four-year window actually made money historically, and it is somewhat unlikely that return chasers focus almost exclusively on five-year and longer returns in driving their return chasing.13 Second, unlike return chasing as defined herein, it is hard to see how trend following strategies with too long a window generate price impact patterns that would make trend following with a one-year window profitable. A more exhaustive review of other possible definitions of return chasing would be valuable.
Explaining Other Profitable Active Strategies
The impact of return chasers explains strategies beyond simple trend following. Naturally, it explains all the strategies that are (sometimes unrecognized) cousins of trend following such as those using tight stop losses to “cut your losses early and let your profits run” (PT Jones, Soros, L Bacon, BH), or the value investors who intentionally adjust their allocations slowly through “sliced” or “lagged” strategies (GMO), or those who unintentionally move slowly because they invest in illiquid investments that take time to analyze (Oak Tree). This simple model also helps us understand a possible source of return for pure value investors, as, about half the time, return chasers move prices away from fair value. The model also provides some testable predictions, such as that we should observe reversion to fair value being a faster moving adjustment than the move away from fair value. While value investing has a long tradition with persuasive proponents on its side (from Graham to Buffett to Klarman), it does not appear to generate as attractive a return profile as trend following, which perhaps is what we should expect from a strategy that has so much intuitive appeal as value investing.
Looking Forward
In conclusion, that thriving investment manager was on to something: despite its superficial similarity with the historically profitable strategy of trend following, return chasing may indeed be investing’s “original sin.” Worse, when the return chasing crowd becomes too big, they may be the primary cause of the too frequent bubbles and busts our system suffers. From the narrower perspective of trend followers and value investors, return chasers may be the ones paying the rent, although every once in a while they thin out the ranks of value investors too. What the future holds is not so clear. It depends on the relative size of capital engaged in return chasing, trend following, value investing and other dynamic investment strategies. The attractive historical returns of trend following and value investing will likely continue to attract capital to those strategies, while the ongoing education and “passive-ication” of investors ought to reduce return chasing. Capital dedicated to trend following will continue to be volatile. In most investment strategies it is possible to identify the source of the expected return, by for example measuring the relative PE of value stocks as compared to growth stocks. For investors considering trend following strategies the main way to calculate expected returns is, ironically, with reference to historical returns. Trend following produces a Sharpe Ratio in the vicinity of 0.5, which may not be high enough (especially when high fees are involved in delivering it) to hold dedicated capital in the long term. Just how far these relative changes in investor behavior go is hard or maybe impossible to predict as the complex and adaptive interaction between the strategies, including return chasing of the strategies themselves, may mean a long-term equilibrium just does not exist.
Further Reading and References:
- Asness, Clifford S., Tobias J. Moskowitz and Lasse Pedersen. “Value and Momentum Everywhere,” Journal of Finance. (2013)
- Barber, Odean. “The Behavior of Individual Investors.” Working Paper. (2011)
- Barber, Odean. “Trading Is Hazardous to Your Wealth: The Common Stock Investment Performance of Individual Investors,” Journal of Finance. (2000)
- Barberis, Shleifer. “Style Investing,” Journal of Financial Economics. (2003)
- Borri, Cagnazzo. “Chasing Stock Market Returns.” Working Paper. (2015)
- Chabot, Ghysels and Jagannathan. “Momentum Trading, Return Chasing, and Predictable Crashes.” Working Paper. (2014)
- Cochrane, John. “The Dog That Did Not Bark: A Defense of Return Predictability,” Review of Financial Studies 21(4) 1533-1575. (2008)
- Dichev, Ilia. “What are stock investors actual historical returns? Evidence from dollarweighted returns.” Working Paper. (2014)
- Fama, Eugene F. and Kenneth R. French. “Dissecting Anomalies,” Journal of Finance 63:1653-1678. (2008)
- Friesen, Sapp. “Mutual fund flows and investor returns: An empirical examination of fund investor timing ability,” CBA Faculty Publications. (2007)
- Geczu, Samonov. “215 Years of Global Multi-Asset Momentum: 1800-2014.” Working Paper. (2015)
- Gnedenko, Boris and Igor Yelnik. “Dynamic Risk Allocation with Carry, Value and Momentum.” Working Paper. (2014)
- Grimaldi, Marianna and Paul De Grauwe. “Bubbling and Crashing Exchange Rates,” CESifo Working Paper Series No. 1045. (September 2003)
- Hilibrand, Lawrence. “Expected Returns, Over-Extrapolation and Asset Pricing.” Working Paper. (2015)
- Hurst, Brian, Yao Hua Ooi, Lasse Pedersen. “A Century of Evidence on Trend Following Investing.” Working Paper 24. (2012)
- Jegadeesh, Narasimhan and Sheridan Titman. “Returns to Buying Winners and Selling Losers: Implications for Stock Market Eciency,” The Journal of Finance, vol. 48, no. 1, pp. 65-91. (1993)
- Kahneman, Daniel and Amos Tversky. “Judgment Under Uncertainty: Heuristics and Biases,” Science. (1974)
- Kinnell, Russell. “Mind the Gap 2015,” Morningstar. (2015)
- Lou, Dong. “A Flow-Based Explanation for Return Predictability.” Working Paper. (2012)
- Maymin, Fisher. “Past performance is indicative of future beliefs,” Risk and Decision Analysis. (2010/11)
- Moskowitz, Ooi and Pedersen. “Time Series Momentum,” The Journal of Financial Economics vol. 104. (2012)
- Pirrong, Craig. “Momentum in Futures Markets.” Working Paper. (2005)
- Vayanos, Woolley. “An Institutional Theory of Momentum and Reversal,” Review of Financial Studies. (2013)
- This not is not an offer or solicitation to invest, nor should this be construed in any way as tax advice. Past returns are not indicative of future performance.
The authors would like to thank Larry Hilibrand, Richard Dewey, Paul De Grauwe, Andy Morton, Bob Shiller, Antti Ilmanen, Ayman Hindy, Aneet Chachra, David Modest, Phil Maymin and Jeff Rosenbluth for their contributions to this research. We thank Bob Shiller for his generous provision of the data that makes research like this possible.
- These are the words of Gene Fama and Ken French (2008). This note is primarily concerned with what in the literature is referred to as time series momentum, as opposed to cross-sectional momentum, however, most of the modeling and discussion can be applied to both manifestations of asset price momentum.
- We could have used 6 or 18 months, or the average of the past year for the look-back window, and all these as well as many other variations would all have been similarly effective.
- See “Investing for the Rest of Us,” Haghani and Dewey (2011).
- See, for instance, this paper: “Time Series Momentum” (2010).
- We limit the investor’s equity exposure to be greater than 0% (i.e. no shorting) and less than 100% (no leverage).
- Let’s illustrate with an example. Suppose we look at $1 invested in some mutual fund over a ten year period, with all dividends reinvested. Let’s say that $1 grew into $2.16 after 10 years. We’d say the fund had an 8% return (1.0810 = 2.16). That’s what’s called the “fund return.”
Now let’s take a simple case where the fund started out with $100mm of investor assets, and for five years grew those assets at 12% a year, to $176mm. At that moment, new and/or existing investors invest a further $200mm into the fund, bringing its assets up to $376mm. Now for the next five years, the fund grows at only 4.14%, which I chose because growing for five years at 12% and then five more years at 4.14% gives an 8% return over the whole period. At 4.14%, the $376mm grows to $460mm at the end of 10 years, giving an investor dollar weighted return of 6.44%, a whole 1.56% lower than the fund return.
- See these sources to go deeper: Morningstar’s “Mind the Gap,” Dichev, Barber & O’Dean, Friesen & Sapp, or Dalbar.
- Larry Hilibrand pointed out to us the following calculation: Imagine that investors in aggregate have 50% of their savings in equities and 50% in cash. If all investors want to increase their equity holdings to 51%, the only way that can happen (assuming companies don’t issue more equity) is for the price of equities to go up so everyone’s equity holdings on average are 51%. For an investor with a portfolio of $100, that means that the $50 they have in cash needs to become 49% of their portfolio, and hence their total portfolio needs to be worth $50 / .49 = $102.04 , and so their $50 equity holdings has to go up in price by $2.04, or 4.08%.
So a 1% increase in allocation would lead to a rather large 4% move in equity prices. Hence, expecting that if return chasers increased their equity holdings by 1% we’d see a price impact of 0.5% is quite a conservative assumption in terms of how small a part of the overall market return chasers would need to comprise, or how big the value investors are, who will tend to decrease their holdings when prices are pushed up by return chasers. Starting at allocations other than 50/50 give higher sensitivities. For example, a 1% increase in equity allocation from 25% or 75% would require a 5.4% increase in equity prices. In general, dP / dS = 1 / (S * (1 – S)), where S is the starting allocation and P is the equity market price.
- Removing the (0,2x) bound on how far return chasers can move from their baseline exposure can lead to runaway asset prices, which results in unrealistically high returns for return chasers and trend followers, and the extinction of value investors.
- Return chasing doesn’t have to be a “mistake.” It can also arise from other pro-cyclical phenomena, such as employee bonus payments being positively correlated with a booming stock market and being invested upon receipt (e.g. Bernanke et al’s Credit Channel/Financial Accelerator theories).
- See Moskowitz, Ooi and Pedersen, “Time Series Momentum” (2012), Asness, Moskowitz and Pedersen, “Value and Momentum Everywhere” (2013), or Haghani and Dewey “Investing for the Rest of Us.”
- A six-month momentum window is also profitable, so the too short a window explanation doesn’t fit either.