December 18, 2018
How Elm Works
When They Won’t Accept That You Really Don’t Know, Tell Them About Mo
By Victor Haghani and James White 1
Most of us working in the finance industry are used to being regularly called on to predict where different assets are heading. We figure out pretty quickly that it’s impossible to know where anything is going with the degree of certainty that our inquisitors often seem to expect. But there are occasions, like a holiday dinner at your in-laws, when it just won’t do to answer with “I really have no idea” and then proclaim your belief in the Efficient Market Hypothesis. In this note, we’ll propose a solution: move the discussion to momentum (or “Mo” for short), and the light it sheds on the question being asked.
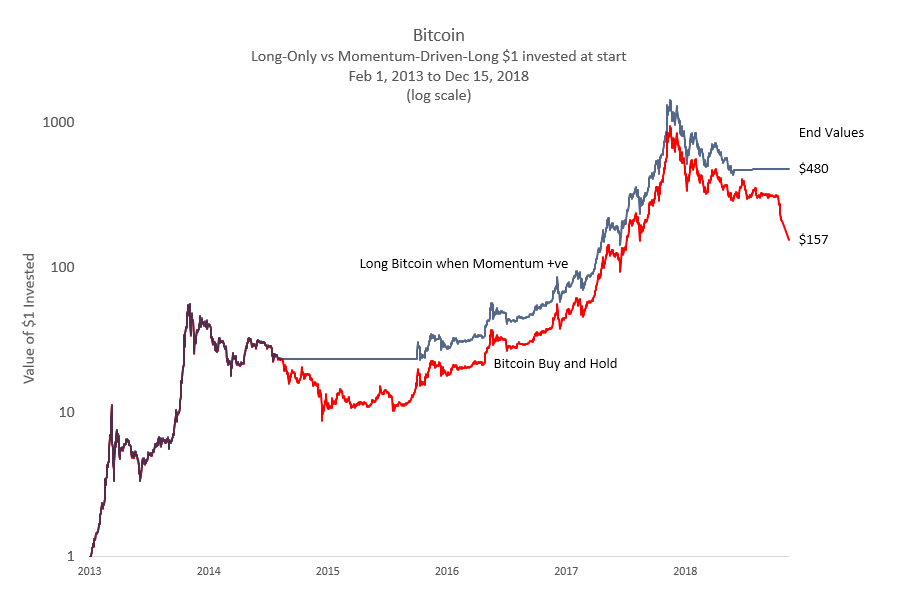
The harder it is to pin down the fair value for an asset, the handier momentum seems to be. Take Bitcoin, the epitome of an asset whose value is difficult to establish. Is it going to rival the value of dollars in circulation and gold above the ground, or is it headed to zero? You’d have been a hero if you’d told family and friends to buy some Bitcoin about six years ago when it traded at $20.2 It’s gone up about 150-fold since then, for an annual return of about 140%, or 8% a month. That seems about as good as it gets, but actually it’s not quite. If you were a Bitcoin know-nothing (like us) but you believed in momentum in asset prices, and especially in ones that are hard to value, then your advice would have made you an absolute legend. Owning Bitcoin only when its price exhibited positive momentum would have resulted in a 500-fold investment multiple with about the same volatility of returns as a buy and hold strategy.3 The momentum strategy that would have produced this return works like this: every month-end, if Bitcoin’s current price is higher than its average price over the past year, momentum is positive and you hold Bitcoin for the next month. Otherwise when its price is lower than its one-year average, momentum is negative, and you hold T-bills for the next month. The simulated returns we show in the chart below do not include transactions costs, but in the case of Bitcoin over this period the strategy would have only demanded a trade once every two years on average.
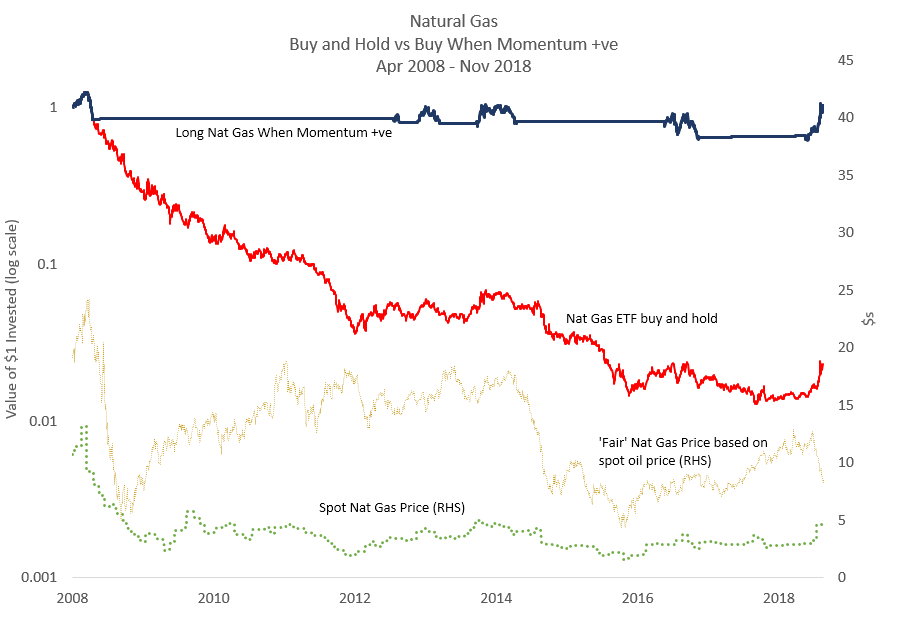
Natural gas is another trade that’s come up frequently over the years and is a good contrast to Bitcoin. What’s generated interest in this trade is the fact that the energy content of 1 unit of natural gas is about 1/6th that of a barrel of oil, and, over the past twelve years, the price of natural gas has traded at an average discount of 68% to this energy content-based “fair value”. 4 That’s about as cheap as an asset gets. In fact, it’s so cheap it strongly suggests an incomplete model. And indeed a little bit of knowledge can be dangerous: the popular natural gas ETF with ticker UNG became available in early 2008, and since then an investment in UNG would have lost 98% if held to the end of November 2018.5 That’s an annualized return of -30%.6 Ouch! Instead, as with the Bitcoin example, if you were oblivious of the “value” of natural gas but only conscious of the tendency of market prices to exhibit momentum, you might have saved your friends a fair bit of change. The same momentum-based approach as applied to Bitcoin, being long natural gas only during the roughly 20% of the time that momentum was positive would have resulted in a small gain over the period instead of a 98% wipeout.
So, if you find yourself at your office Christmas party or a family holiday dinner, pressured by etiquette to proffer an opinion about a speculative trade you know nothing about, tell your audience these twin tales of how Mo can make you more dough or save you from woe.7 In the true holiday spirit, you’ll have made the gift of a fishing rod rather than a fish.
Charts:
- This not is not an offer or solicitation to invest, nor should this be construed in any way as tax advice. Past returns are not indicative of future performance.
- Six years is as far back as we have data to do this analysis.
- Measured as annualized standard deviation of returns.
- US natural gas, which is the type easily traded, also has been priced at a steep discount to natural gas in most of Western Europe and Asia.
- A more logical expression of the view that natural gas is cheap to oil would have been to go long natural gas and short oil. Indeed, over this period, the largest oil ETF, USO, was down 88%, but the trade of being long UNG and short an equal dollar amount of USO, rebalanced back to offsetting amounts on a monthly basis, would have resulted in a loss of 90%, over the period. A simple momentum overlay applied to this relative value trade resulted in a gain of 4% over the period, ignoring transactions costs and the cost of borrowing USO to be short it. Exploring this surprising result warrants its own short note.
- This is a Sharpe Ratio of about -0.7, which is pretty good, except for the negative sign in front. What this means is that shorting UNG, or the natural gas futures it is based on, would have been a very high quality trade. Over that period, the spot price of natural gas dropped “only” about 50%, while the rest of the loss came from futures rolls where the market, just like our value-conscious friends, expected the price of natural gas to go up in the future.
- If your audience rightly isn’t convinced by two cherry-picked examples viewed over relatively short horizons, refer them to this comprehensive piece of research, which also has an exhaustive list of references, on the prevalence of momentum over the past 200+ years: Geczy, Christopher and Samonov, Mikhail, Two Centuries of Price Return Momentum, Financial Analysts Journal, Vol. 72, No. 5 (September/October 2016)