March 26, 2025
Featured Insights
Portfolio Rebalancing: Free Lunch or Empty Calories?
By Victor Haghani and James White 1
ESTIMATED READING TIME: 8 min.
As market prices change over time, so will the fraction of your portfolio which is in stocks or bonds. How often should you rebalance your portfolio back to your desired asset allocation? And how much is that rebalancing worth?
Almost every book on personal investing advocates bringing your asset allocation closer to your desired weights at least once per year. “Rebalancing reduces the volatility and riskiness of your investment portfolio and can often enhance your returns…In the long run, investors who rebalance their portfolios in a disciplined way are well rewarded,” say legendary personal finance experts Burton Malkiel and Charles Ellis.2
On reflection, we realized we’d never come across an analysis of the size of the expected benefit of such rebalancing. We decided to take a look, and we felt our findings were interesting enough to share in this note. The main insight from our analysis is that, for a static target asset allocation, there’s a negligible difference in expected risk-adjusted return for just about any rebalancing frequency you might like. Rebalancing your portfolio every year or two or three is good practice, but it doesn’t rank among the most critical financial decisions you need to be focused on.
In contrast to individual stock ownership, where passive investing in a portfolio of stocks in proportion to their market capitalization is a sensible option for many investors, we believe that asset allocation should always be an active decision. In particular, your asset allocation should be changing to reflect the current expected reward and risk of the asset classes in which you can invest – but for the analysis in this note, we’re going to put dynamic asset allocation to the side and focus solely on investors who want to keep their asset allocation static over time.3
Let’s assume you believe stocks have an expected average annual return 4% higher than safe fixed income assets, and that stock returns have 15% volatility per year.4 In the real world, stock prices are not so well-behaved, but this assumption doesn’t materially affect our findings. We’ll also assume that you’re on the more risk-averse end of the spectrum, translating that expected return and risk into a desire to have 60% of your portfolio in stocks and the rest in bonds.5
In the chart below, we compare the value to you of rebalancing your portfolio frequently versus not doing any rebalancing at all, to different horizons. We’ll refer to the two ends of the extreme as “continuous rebalancing” and “buy and hold.” We measure the value in terms of annual risk-adjusted return. Risk-adjusted return is the lowest return you would be willing to accept to forego a particular risky investment portfolio. The more risk-averse you are, the lower the risk-adjusted return of any given stock-bond portfolio.
Notice how small the differences are between the risk-adjusted return of the continuously rebalanced versus buy-and-hold investment strategies. Up to a four-year horizon, high-frequency rebalancing is worth less than 0.01% (1 basis point) per annum versus buy-and-hold, and rebalancing every five years is less than 1 basis point worse than rebalancing annually. We’re not advocating you abstain from rebalancing your portfolio for such long periods, but it’s comforting to know that even to a 20-year horizon, the expected risk-adjusted cost of such neglect is less than 0.04% per annum. In case you’re wondering, there’s no intermediate frequency of rebalancing that’s better than the continuous. Also, these results don’t change much over a reasonable range of values for the expected excess return and risk of the market and investor risk-aversion, nor do they change much in the context of a portfolio that has more than two asset buckets.
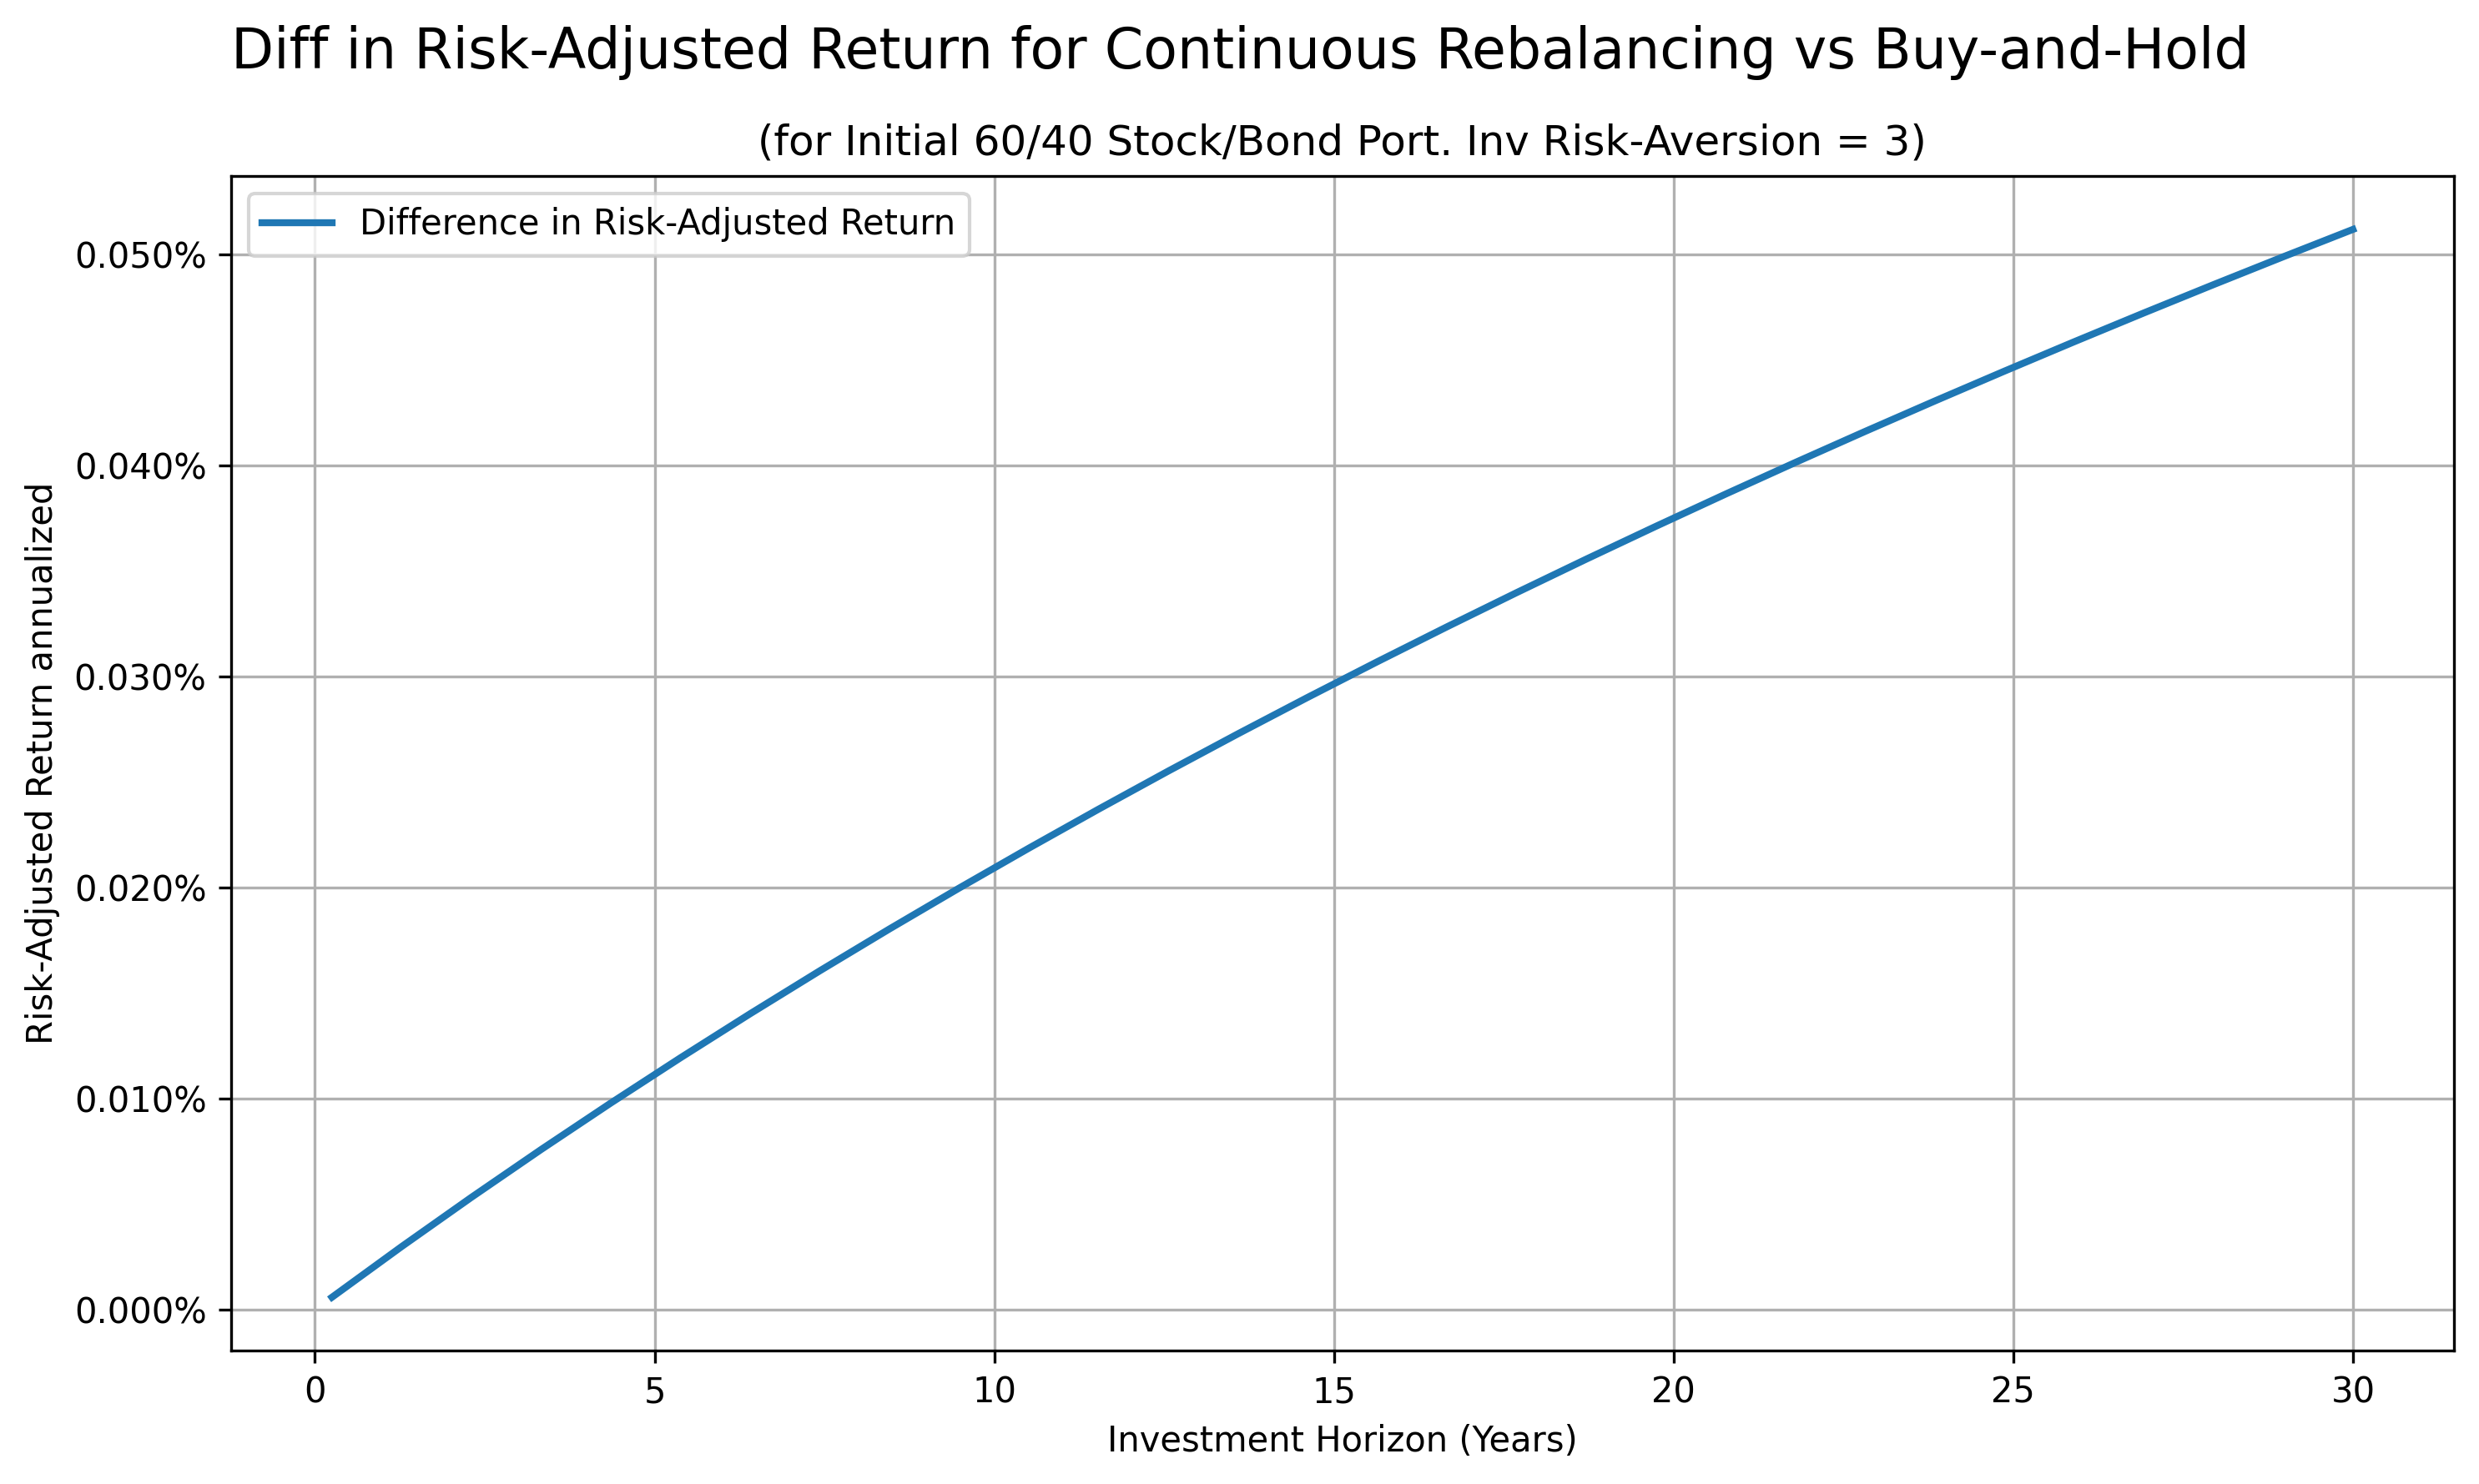
The reason the differences are so small is because the risk-adjusted return curve is very flat near the optimal allocation to stocks. If your optimal allocation to equities is 60%, but you find yourself holding 70% in stocks, your risk-adjusted return would just be 0.03% lower than at the 60% optimal holding.6 And if you are following a static asset allocation, you shouldn’t expect to find yourself 10% adrift of your target too often. For example, it would require stocks to outperform safe assets by a whopping 55% for the weight of stocks in your portfolio to go up from your target of 60% to 70%.
In order to construct the chart above, we had to find the optimal fraction to hold in equities in the buy-and-hold strategy for each horizon. For the continuously rebalanced strategy, 60% is optimal no matter your investment horizon. In the case of the buy-and-hold, the optimal allocation changes with horizon. In the chart below, we show how that optimal allocation changes, measured against the continuously rebalanced strategy. For each case, when the horizon is very short, the optimal equity allocation for continuous rebalancing and buy-and-hold are the same, and the differences remain small even for multiple decade horizons.
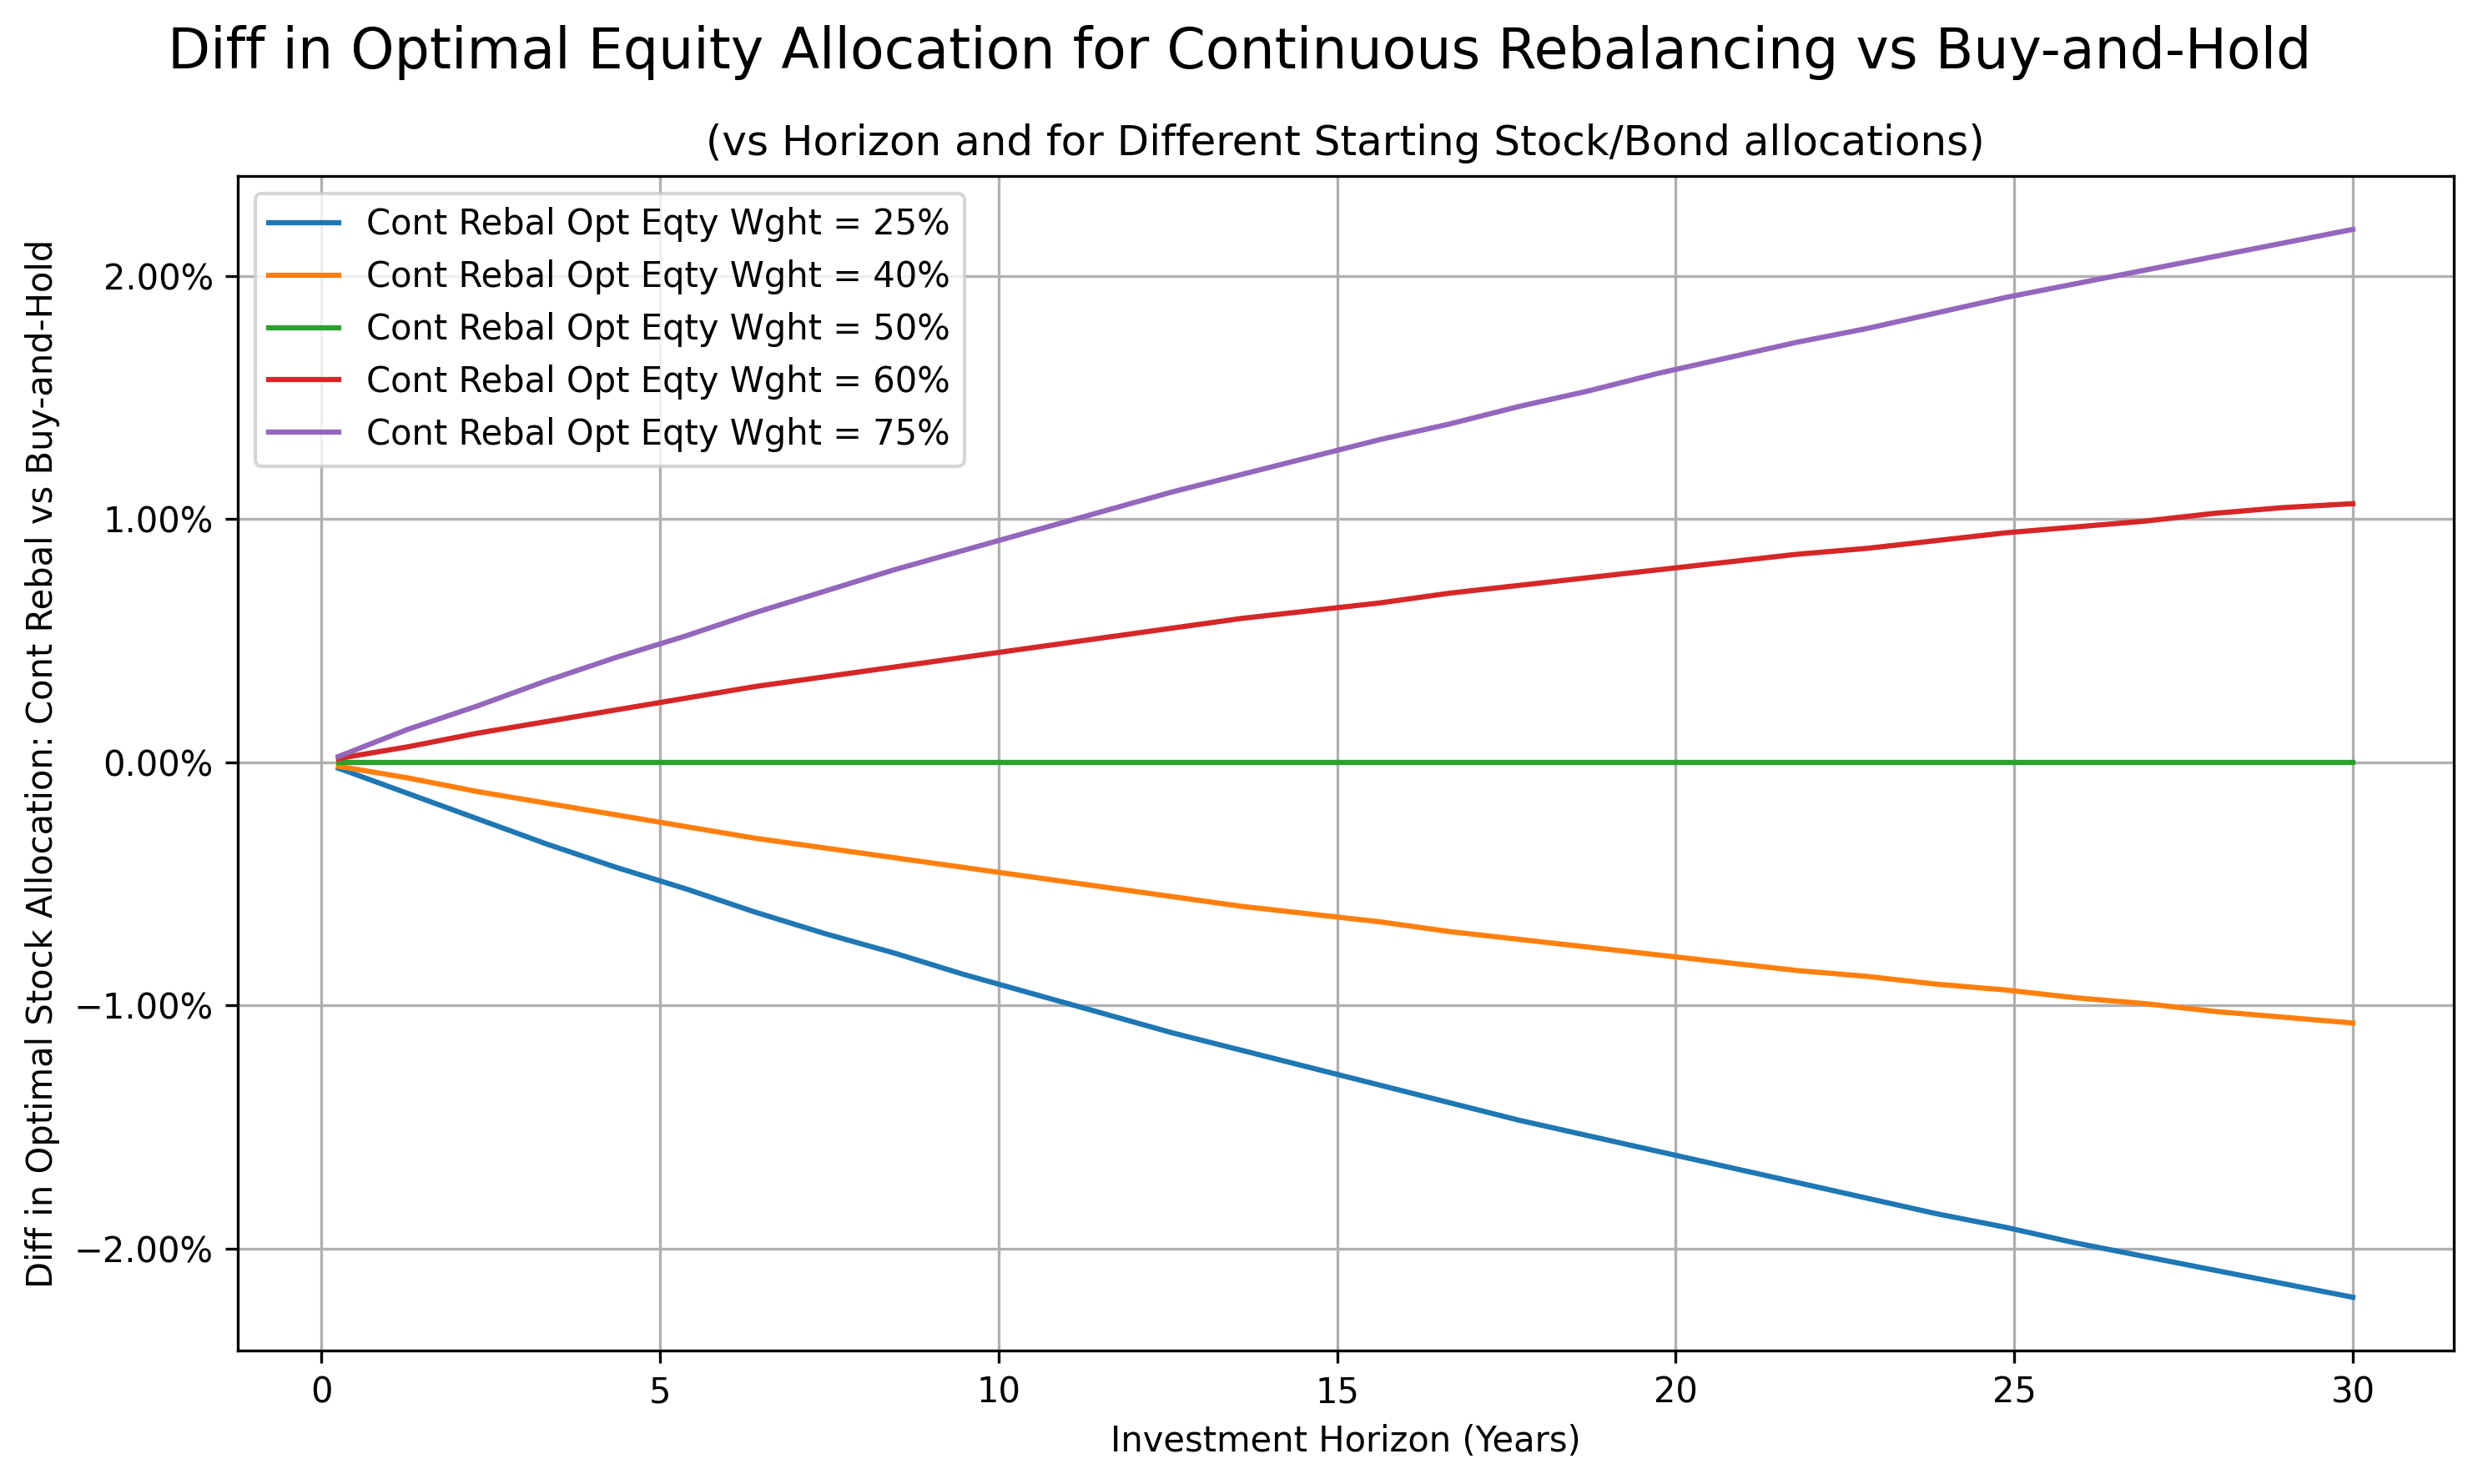
Notice that, for the 25% and 40% optimal continuously rebalanced holding of stocks, the buy-and-hold optimal is a bit below 25% and 40% for all horizons while the opposite is true for an optimal continuously rebalanced allocation of 60% and 75%. This result puzzled us, and we haven’t found a simple explanation in the finance literature.7 Our best guess is that it results from the fact that when your desired allocation to equities is high, then there’s less room for the allocation to go higher as it’s bounded above by 100%, while it can fall all the way to 0% if stocks do poorly over the buy-and-hold horizon8 – and this operates in the other direction when the desired allocation is less than 50%.
These results are interesting, but they are based on a stylized representation of markets, with the stock market following a random walk, without mean-reversion or momentum, and without discontinuities, fat tails or skew in the distributions. The possibility of crashes and other tail events call for lower optimal buy-and-hold allocations.9 If you believe that stocks are more attractive when they decline in price, and vice versa, then you’ll want to rebalance your portfolio more frequently, while if you believe that the stock market exhibits momentum, then you’ll want to rebalance less frequently – or, if you are following a dynamic asset allocation with highly variable target weights, then rebalancing frequently can add a lot of risk-adjusted value. Once you decide on your rebalancing frequency, we encourage you to stick to your decision in a disciplined and systematic manner to keep our investing gremlins at bay. In the interests of keeping this note short, and also as we’re not strong believers in the past predicting future stock market behavior, we’ll leave a historical risk-adjusted return analysis of different rebalancing frequencies for future research.
In conclusion, you can cross “rebalancing frequency” off of the list of big financial decisions you need to make, allocating that extra bandwidth to more consequential ones, such as how much to save and spend, how much equity exposure you want in your baseline, whether to follow a static versus dynamic asset allocation, or how much international versus domestic equity exposure to have.
Further Reading and References
- Ellis, C. and Malkiel, B. (2022). The Elements of Investing: Easy Lessons for Every Investor. John Wiley and Sons, Inc.
- Haghani, V. and White, J. (2023). The Missing Billionaires: A Guide to Better Financial Decisions. Wiley.
- Merton, R. (1969). “Lifetime Portfolio Selection Under Uncertainty.” The Review of Economics and Statistics 51:3, 247 – 257.
- Woglom, G. (2013). “The buy-and-hold horizon and portfolio choice.” Quantitative Finance 13:2, 159 – 166.
- This is not an offer or solicitation to invest, nor are we tax experts and nothing herein should be construed as tax advice. Past returns are not indicative of future performance. Thank you to Professors John Campbell and Nick Barberis for pointing us to relevant areas of the academic literature, and to Jeff Rosenbluth and Larry Hilibrand for their comments.
- From The Elements of Investing (2022), pp 52 – 53. Princeton economist Malkiel is perhaps best known for his classic A Random Walk Down Wall Street, and Charles Ellis for his influential Winning the Loser’s Game.
- In “Victor Meets the Bogleheads” (October 2024), we discuss the circumstances under which it makes sense for an investor to follow a static asset allocation rather than a dynamic approach.
- We’re also ignoring taxes and transactions costs in this analysis, both of which reduce the value of frequent portfolio rebalancing.
- We’d say that you have a coefficient of risk-aversion equal to 3 in a Constant Relative Risk-Aversion utility function. To get to a desired allocation of exactly 60% to stocks, we use 4.05% as the annual continuously compounded average expected return of stocks over bonds, with 15% risk and CRRA risk-aversion of 3. This gives .0405 / 3 / .152 = 60% exactly.
- Both assuming continuous rebalancing and also our other assumptions made to this point.
- Woglom (2013) explains the effect well mathematically.
- Another perspective is to note that, if you start with 60% in equities and rebalance frequently, there are downside cases where you lose more than than the 60% you had in equities. For example: say that stocks go down 90% and you keep rebalancing to your 60% target every time they drop 10%. At the end, you’ll have lost 75% of your wealth, more than what you started with in stocks. In the buy and hold, you’d wind up with about 46% of your starting wealth.
- As shown by Woglom (2013).