March 3, 2025
Featured Insights
Still Working the Night Shift
By Victor Haghani, James White, Richard Dewey and Vlad Ragulin1
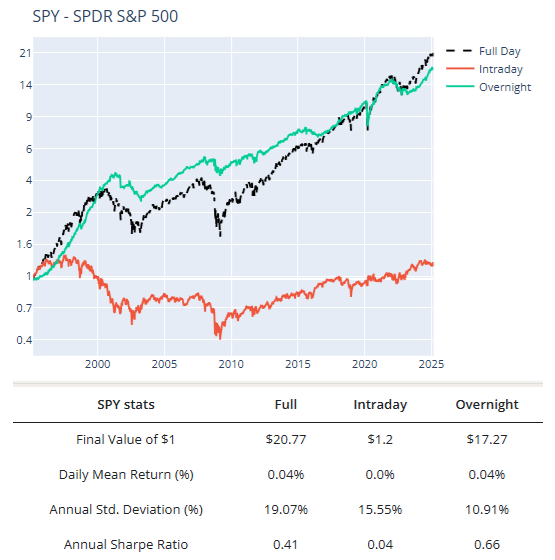
Here is an idea that defies conventional wisdom: the stock market has delivered most of its return in the night-time, when it’s fast asleep. Over the past 30 years, $1 invested in the S&P 500 ETF SPY from the open to the close of the stock market day session would have grown to just $1.20, a rate of return below that of Treasury Bills. Meanwhile, $1 invested over those 30 years overnight – buying each day at the market close and selling at the market open the next day – would have grown to $17.27.
What?!?
This phenomenon – the Overnight Drift – is perhaps the most persistent and statistically significant anomaly in global markets, yet it remains largely unexplained after 15+ years of research.
So what’s going on here? Some argue markets are riskier at night,2 others point to frictions and funding costs. Bruce Knuteson, a former particle physicist who worked at DE Shaw, has more provocative theories about possible price manipulation by large quantitative trading firms. Check out his papers on his website and SSRN.
We investigated this puzzle, focusing on a new angle: meme stocks, or what we referred to more broadly as “attention” stocks.
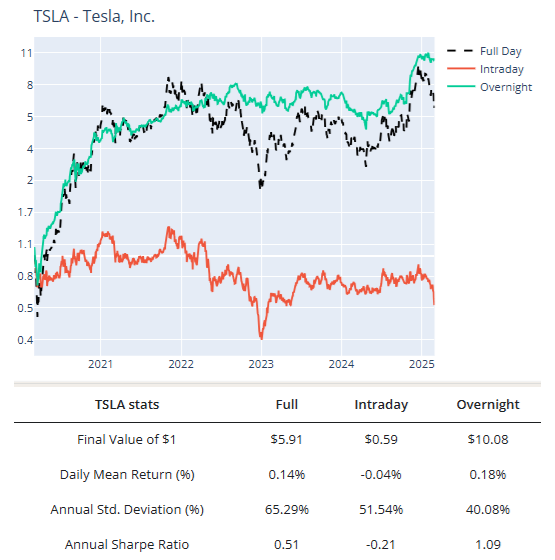
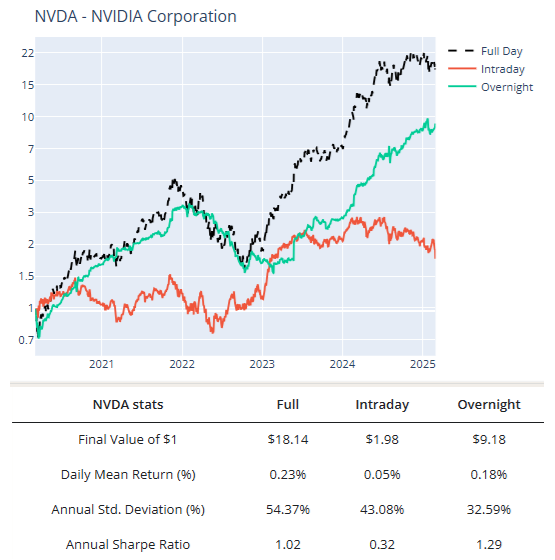
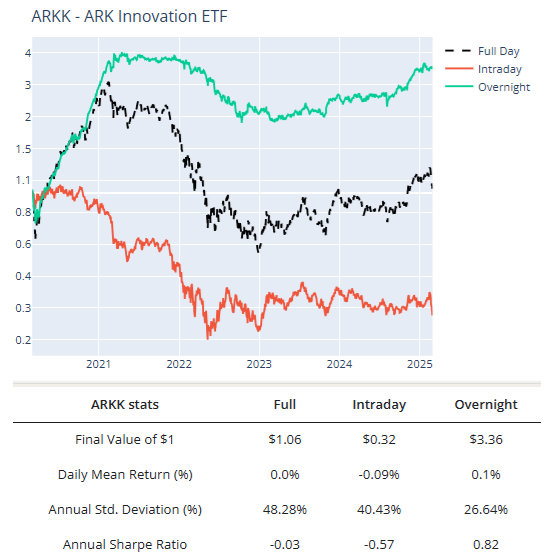
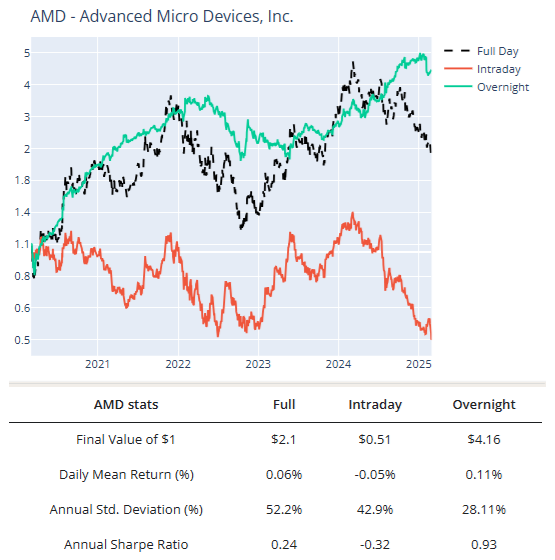
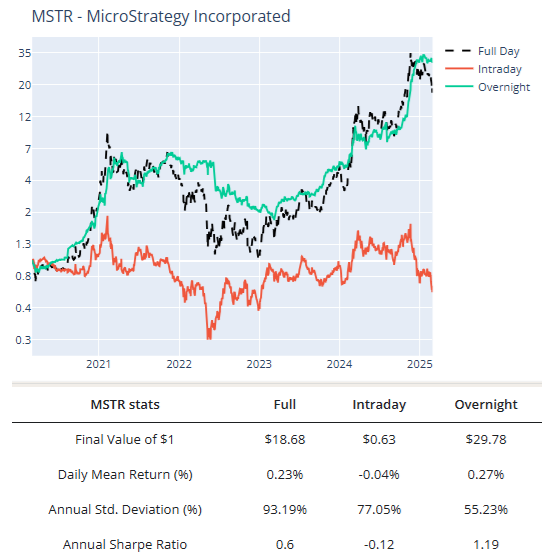
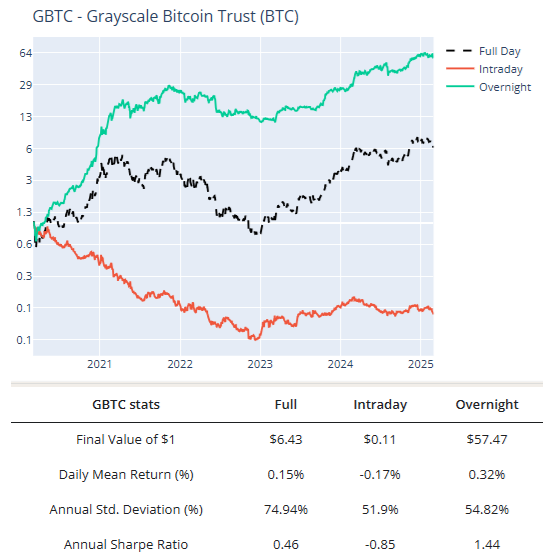
We discovered something fascinating – the overnight effect is even more pronounced in stocks like Nvidia, Tesla, Advanced Micro Devices, and MicroStrategy, and going beyond single stocks to Bitcoin or the ARKK ETF, as can be seen in the charts below. We generated these charts and statistics with our publicly available overnight return calculator.
Our hypothesis is that the overnight effect would be most pronounced in stocks that attracted the highest degree of retail day-trading. As one test of this hypothesis, we asked ChatGPT for the 20 most popular stocks with US retail investors and the 20 stocks with the highest option trading volume on US exchanges. This gave us 32 stocks, which we pruned by removing those that weren’t super volatile – i.e. with less than 3% daily price volatility. This left us with the 23 stocks and ETFs below. We generated the five-year returns below with our overnight return calculator, which we encourage you to use to compare overnight versus daytime and full day returns of any stock or ETF.
| Stocks and ETFs most popular with retail investors | $1 invested turns into: | |||
| Ticker | Whole Day | Day-Time | Night-Time | |
| AMC | AMC Entertainment | 0.05 | 0.0005 | 102.44 |
| ETHE | Ethereum Grayscale Trust | 1.50 | 0.01 | 276.58 |
| MARA | Mara Holdings | 15.82 | 0.11 | 146.62 |
| GBTC | Bitcoin Grayscale Trust | 6.43 | 0.11 | 57.47 |
| SPCE | Virgin Galactic | 0.01 | 0.004 | 1.75 |
| ANY | Sphere 3D Corp. | 0.13 | 0.02 | 5.78 |
| KOSS | Koss Corp | 4.39 | 0.22 | 19.69 |
| MSTR | MicroStrategy | 18.68 | 0.63 | 29.78 |
| GME | Gamestop | 26.15 | 0.86 | 30.45 |
| DJT | Trump Media & Tech Group | 2.42 | 0.44 | 5.54 |
| TSLA | Tesla | 5.91 | 0.59 | 10.08 |
| ARKK | ARK Innovation Trust ETF | 1.06 | 0.32 | 3.36 |
| NOK | Nokia | 1.34 | 0.38 | 3.52 |
| NIO | Nio, Inc. | 1.13 | 0.38 | 2.94 |
| AMD | Advanced Micro Devices | 2.10 | 0.51 | 4.16 |
| HIMS | Hims & Her Health | 4.49 | 0.81 | 5.53 |
| BB | Blackberry | 0.93 | 0.41 | 2.29 |
| NVDA | Nvidia | 18.14 | 1.98 | 9.18 |
| APP | Applovin Corp. | 5.00 | 1.43 | 3.51 |
| COIN | Coinbase | 0.66 | 0.71 | 0.92 |
| SMCI | Super Micro Computer | 15.85 | 3.59 | 4.42 |
| PLTR | Palantir | 8.94 | 3.05 | 2.93 |
| HOOD | Robinhood | 1.44 | 1.78 | 0.81 |
| SPY | S&P 500 ETF | 2.07 | 1.25 | 1.66 |
| Average Growth of $1 | 6.2 | 0.8 | 31.7 | |
| Average Sharpe Ratio | 0.2 | -0.3 | 0.7 | |
| S&P 500 SPY Sharpe Ratio | 0.6 | 0.3 | 0.5 | |
| Sharpe Ratio of Equal Weighted Portfolio | 1.3 | 0.0 | 2.0 | |
The numbers in the table here are quite remarkable. Over the past five years, these stocks appreciated almost six-fold. However, you’d have lost 20% if you had only invested in them during the day-time, while generating a 32-fold payoff if you held them only during the night-time.3 Only one of them, Robinhood, had a lower return in the night-time than the day-time. Notice also that three stocks – AMC, SPCE and ANY – lost more than 90% of their value on average when held day and night together, but actually increased more than 30-fold on average in the night-time.
One possible cause of this pattern of returns is that retail day-traders naturally tend to buy in the morning and to close out their trades later in the day. Victor recently gave a lecture at the London School of Economics where he suggested that the temporal pattern of day-trading by retail investors – including his 90-year-old mother – may be a driver of the overnight drift in the stocks they most actively trade. We believe this research adds to the already substantial evidence that active trading is hazardous to the wealth of retail investors.
We are not advocating that investors adopt a strategy of only owning stocks in the night-time. The transaction costs, including market impact, that most investors face would erase most or all of the total expected gain from such a strategy. Indeed, in late 2022, shortly after we published our research as a working paper on SSRN, an investment manager aptly named NightShares launched a suite of ETFs that tried to deliver superior returns to investors by exploiting the overnight drift with stock index futures. We suspect a large part of the reason they closed their ETFs one year after launch was due to the transaction costs involved in turning over their portfolio in full twice a day.
We’re honored that our work exploring these questions has recently been recognized with the 2024 Harry Markowitz Prize by The Journal of Investment Management (JOIM).
Our paper in the Q2 2024 edition of the JOIM offers a more detailed description of the anomalies, possible explanations and a discussion of the limits of arbitrage. We view this as one of the most important and fascinating unsolved puzzles in market microstructure, and hope our research inspires others to investigate further.
- This is not an offer or solicitation to invest, nor are we tax experts and nothing herein should be construed as tax advice. Past returns are not indicative of future performance.
- Though as can be seen from the chart above, markets have been 50% riskier during the day-time.
- Not all the stocks in the table above had a five year history, but most did.