December 5, 2024
Risk and Return
Moonshot or Shooting Star? A Volatile Mix of MicroStrategy, 2x Leveraged ETFs and Bitcoin
By Victor Haghani and James White1
ESTIMATED READING TIME: 7 min.
A shooting star’s beauty is its curse — it burns itself out to be seen.
– Anonymous
Introduction
We’ve enjoyed lots of feedback since distributing our Leveraged ETF calculator and accompanying research note last week. Most of the incoming questions have asked our views on the 2x leveraged long ETFs MSTX and MSTU, based on the shares of MicroStrategy, Inc. (MSTR). With the caveat that we do not have domain expertise in MicroStrategy, Inc. nor in Bitcoin, we’re excited to share our thoughts on this fascinating situation.
In this note, we’ll:
- Explain why we think 2x leveraged MSTR ETFs are not an attractive investment vehicle using return distributions from our Leveraged ETF tool.
- Estimate the probability of the 2x leveraged MicroStrategy ETFs going bust in the next year at between 20% and 50%.
- Question whether market liquidity is sufficient to support the current size of these leveraged MSTR ETFs.
- Give our perspective on why MSTR trades at such a big premium to its underlying holdings of Bitcoin, and why we think that’s not likely to persist.
- Dive into the concept of “Bitcoin yield” in the context of MSTR, and also explain the “power law” as pertains to estimating BTC’s future return.
- Discuss why we wouldn’t invest in a long BTC vs short MSTR ETF if such an ETF were to be brought to market.
Background
MSTR has received tremendous media and investor attention over the past month. The company is primarily a leveraged-long holder of Bitcoin. Over the past month, MSTR stock is up 95%, while Bitcoin has increased by about 50%, breaking through the newsworthy $100,000 price level on the very day that we’re publishing this article. MSTR stock trades at a substantial premium to the value of the Bitcoin it owns, with the common equity having a market value of about $100 billion, which is about 2.4x the roughly $40 billion of Bitcoin it owns.2
The outspoken founder and executive chairman of MSTR, Michael Saylor, describes his company as a “Bitcoin development company,” while others, such as the Wall Street Journal, refer to it as a “Bitcoin buying machine.”
Saylor has laid out ambitious plans to significantly increase the company’s Bitcoin holdings through a combination of equity and debt financing. In October, he announced the “21/21 Plan,” aiming to raise $42 billion over the next three years — $21 billion through equity issuance and $21 billion via (mostly convertible) bonds. Such issuance would allow MSTR to buy 420,000 additional Bitcoins at the current price, representing about 2% of the total amount of Bitcoins ever created, and a much higher percentage of Bitcoins that are freely traded.
There are several ETFs that provide 2x (and even 3x) leveraged long exposure to MSTR. The two largest right now are MSTU ($3 billion) and MSTX ($1.8 billion). Between them, they own about $10 billion of MSTR common stock exposure through margined longs, swaps or options positions.
What follows are answers to some of the questions our readers have sent our way.
How can I use your tool to analyze the 2x leveraged MSTR ETFs?
Our tool can be found here: Leveraged ETF Tool. For the Long Side, simply input Ticker = MSTR and Leverage = 2, then delete the default Ticker for the Short Side.
Info-tips in the tool give details on the inputs and how it works. The output uses volatility calculated using the past two years of daily data – which, for MSTR was 90% per annum or roughly 5.6% per day. The default input for the risk-free rate is 5%. As an admittedly arbitrary starting point, we set the underlying expected return (of MSTR, in this case) to 8%, which we expect many users will want to override with their own expectations.
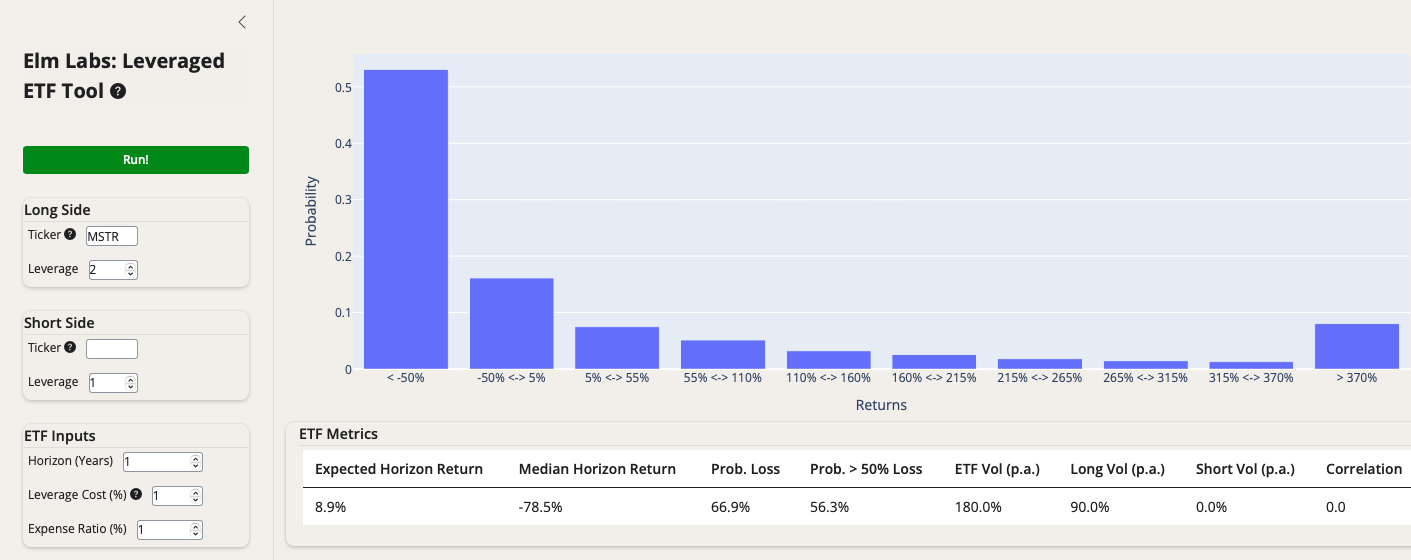
A few things to note in the output for this case, using the default assumptions above:
- While the expected return of the ETF is 8.9%, the median return is a loss of 79%.
- To a one-year horizon, there is a 67% probability of loss and a 56% chance of losing more than 50%.
- There’s a roughly 8% probability of the ETF going up more than four-fold, making the return distribution of this ETF much like a lottery ticket or an out-of-the-money option.
- If the one-year return of MSTR turned out to be 8%, the expected return on the ETF would be a loss of 55%.3
While the past two years’ MSTR realized volatility was about 90%, the options market – which provides a more forward looking estimate of a stock’s volatility – is currently suggesting a much higher variability of about 160% per annum or roughly 10% per day. We provide output from our tool with the same assumptions as above, but with 160% used as the volatility estimate.
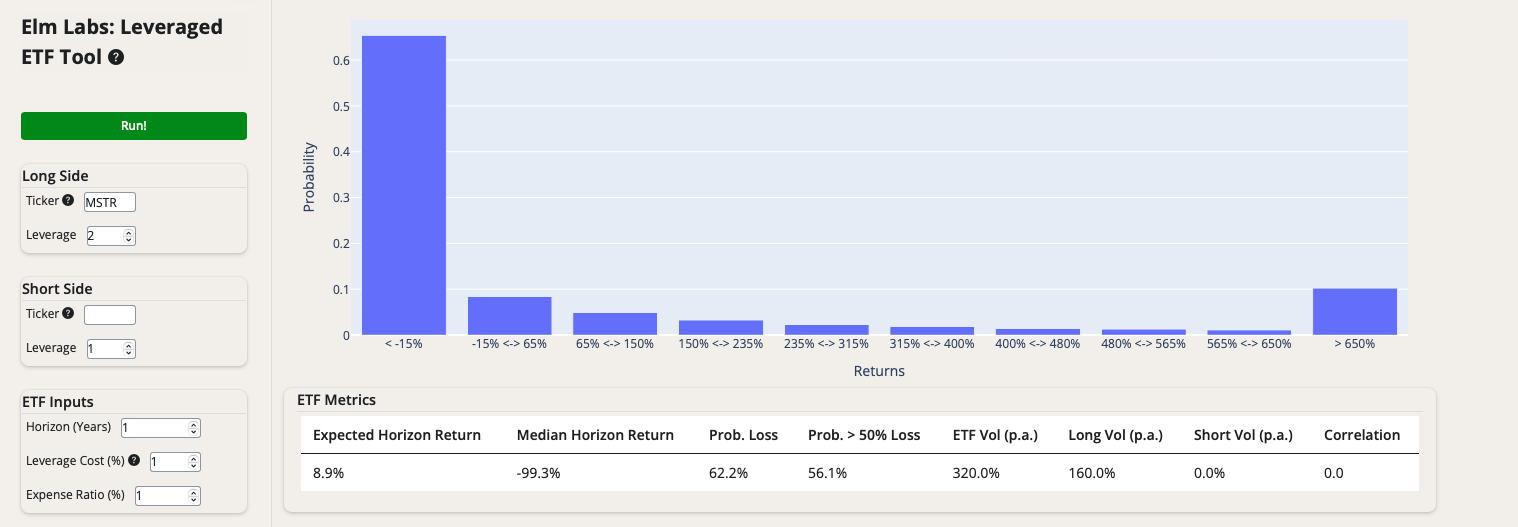
If MSTR bounces around at this extreme level of volatility over the next year, the most likely outcome is that investors will lose 99% of their investment.
What is the probability that a 2x leveraged MSTR ETF goes bust in the next year?
We just saw that, at 160% MSTR volatility – the level implied by the options market – the one-year median return for the 2x leveraged ETF is -99%. This means that there’s a 50% probability of return outcomes being either better or worse – so we can say that, from this perspective, the probability of going bust in this case is about 50% per year. At the 90% two-year historical volatility, the probability of losing 99% or more is about 5%, and there’s nearly a 25% chance of losing 95% or more.
Now let’s use some data to look at the probability of going bust just from a single really bad day. The price of a 2x leveraged ETF should go to zero if the price of the stock underlying the ETF goes down by 50% or more in a single day.4 The probability of such an event is a function of the variability of the MSTR stock price. If we assume the volatility of MSTR will be about 90% (or 5.6% per day), then we could think of a 50% decline in the stock price in one day as being a roughly 9x daily volatility move. A natural question is how often do stocks with very elevated variability, like MSTR, experience days when they decline by 9x their daily variability in returns?
We looked at about 1500 US stocks over the past 50 years, chosen so that at some point they were within the top 1000 stocks by market-cap.5 We found that the annual probability of such stocks experiencing a one-day price decline of 9x daily volatility was about 6%. This isn’t quite the final answer though, as we need the probability of a stock dropping by that much some time during the day, rather than just close-to-close. The usual estimate for the probability of touching a level over some time interval is to simply double the probability of being below that level at the end.6 So, assuming MSTR volatility of 90% per annum, the probability of a down 50% intra-day move occurring at least once over the next year is about 12%.
If we use the MSTR volatility implied by the options market of 160%, then down 50% is only 5x daily volatility. The same data as above yields a close-to-close annual probability of about 30%, which we estimate as about a 60% probability of an intra-day drop that would send the ETF to 0.
There are a number of alternative perspectives one could take in trying to estimate this probability: for instance, trying to estimate the probability of a large one-day drop in Bitcoin and how that might impact the MSTR premium to BTC. For example, a 25% one day drop in BTC and a 33% collapse of the MSTR premium would imply a 50% drop in the MSTR share price.
A more complex analysis might try to estimate whether it is possible for these leveraged ETFs to become large enough that their daily rebalancing trades could themselves drive the price down 50% in one day. For example, imagine that MSTR rapidly triples in price due to some combination of BTC rally and an increase in MSTR’s premium to the BTC it owns, and the assets in the MSTR leveraged ETFs go from $5 billion to $30 billion. The market capitalization of MSTR could be about $270 billion and the leveraged ETFs would be owning $60 billion, or 22%, of MSTR stock outstanding.
Now imagine for some reason, MSTR stock drops 15% during the day – which, given MSTR volatility, would not be unusual. The leveraged ETFs would need to sell $9 billion of MSTR stock at the closing price. Recently, MSTR daily average trading volume at the close of the day has been about $2 billion, so this would be quite an impactful amount of MSTR to sell at the end of the day. For every 1% the price declines further than the 15%, the ETFs will need to sell another $500 million of MSTR, and if that pushes the price down by another 1%…well, you can see this doesn’t have a happy ending for owners of the leveraged ETF or MSTR.
Bottom line, we think there’s a pretty decent probability – somewhere in the range of 15% to 50% – that these 2x leveraged MSTR ETFs are effectively wiped out in any given year if they are not voluntarily deleveraged or otherwise de-risked sooner.
Can the market support the positions and trading activity of the roughly $5 billion of MSTR leveraged long ETFs?
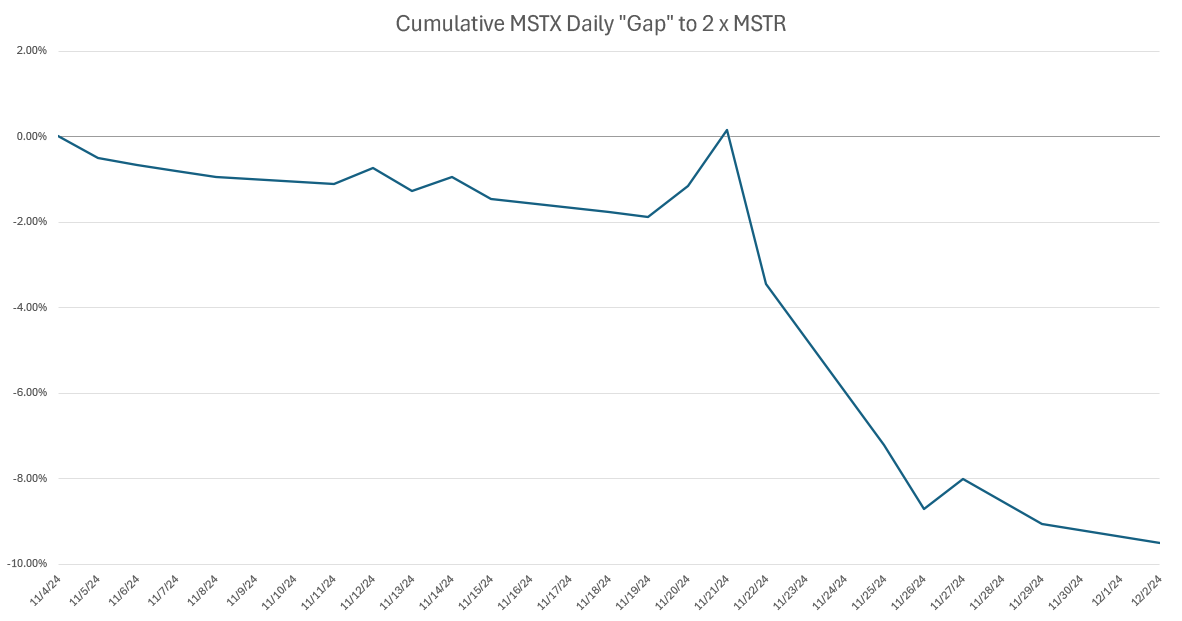
There are signs that these leveraged ETFs are already starting to hit practical market capacity constraints. For example: recently, the daily returns of the ETFs have started to diverge in troubling ways from 2x the daily return of MSTR as displayed in the chart below. We understand that the ETF sponsors are having difficulty managing the advertised exposures in the conventional fashion and have started to rely on using options on MSTR to deliver the desired leveraged exposure.7
Below we can see that the cumulative daily gap between MSTX and 2x MSTR has widened considerably in recent weeks:8
Why is MSTR trading at such a large premium to the value of Bitcoin that it holds?
Some observers suggest that there are many investors, primarily based outside the US, who are unable to own Bitcoin ETFs and are unwilling to own BTC directly or through an exchange such as Coinbase. These investors choose to get their BTC exposure by buying MicroStrategy, hence driving MSTR to a premium versus its BTC holdings. We don’t really think this is what has driven MSTR to its significant premium to its holdings of Bitcoin.
Other investors believe that there’s a decent probability that MSTR becomes a member of the NASDAQ-100 index and/or the S&P 500 index, which would give a price boost to the stock due to demand from index investors.
The below quotes convey a few other perspectives and motivations of buyers of MSTR and the 2x leveraged MSTR ETFs.9
Chase Furey (25) has turned $700,000 of his parents’ retirement assets into $1.8 million by investing in MicroStrategy and a related leveraged ETF.
…He moved all of his investments, worth about $112,000, into the Defiance ETF instead and has grown his portfolio to about $400,000.
The Harvard graduate, who studied economics in college, convinced his parents to let him manage $700,000 of their retirement assets. He said he came up with a “less dangerous and smarter” plan for them, investing 27% of their portfolio in the Defiance [2x leveraged MSTR] ETF and the rest in MicroStrategy shares. The money has more than doubled to $1.8 million, he said.
“I think bitcoin could hit $400,000 and I think MicroStrategy could possibly 10x from where it is now by the end of next year, so that’s kind of my game plan with that,” he said.
[Authors’ Note: we hope he won’t be too Furey-ous if things don’t go according to his game plan.]
George Bodine, a 69-year-old retired airline captain in Covington KY, said he bought a modest stake in MicroStrategy in January that has since grown into a seven-figure position. Bodine, a die-hard bitcoin fan, said he is willing to pay up for the stock because of something called the BTC yield.
The term, which MicroStrategy introduced to investors in August, measures the percentage change in how many bitcoins per share MicroStrategy owns. As of Sunday, the company held 1.45 bitcoins for every 1,000 of its shares outstanding, using a share count that assumed all its convertible debt was turned into stock. That ratio was up 59.3% since Dec. 31 — and the increase is what MicroStrategy calls its year-to-date BTC yield. Based on that stat, Bodine said he now owns more bitcoin per share than he did at the start of the year.
“So in my mind, I’m getting more bitcoin than I could even in the market just buying spot [bitcoin],” he said.
Peter Duan, a 35-year-old wealth adviser in Los Angeles, went all in on MicroStrategy in September after selling his bitcoin and Tesla holdings. Yet he says he wouldn’t recommend MicroStrategy stock to his clients.
“Unless you do the requisite 100-plus hours of studying bitcoin on top of 100-plus hours of MicroStrategy, you should not enter this trade,” he said. “Because it is a very sophisticated trade that 99.99% of Wall Street doesn’t even understand.”
“This is not a YOLO thing, this is not a GameStop thing,” he said. “This is a rigorous exercise that takes a lot of deep first principles thinking.”
What is the meaning of “Bitcoin yield” in the context of shares of MSTR?
The concept of “Bitcoin yield” in the context of investing in MicroStrategy (MSTR) stock refers to the increase in Bitcoin ownership per share over time. This is not a traditional yield like dividends or interest, but rather a measure of value creation unique to MicroStrategy’s Bitcoin-focused strategy. The company issues both equity and convertible debt to acquire more Bitcoin, and if it can issue this capital at a higher and higher premium to the underlying Bitcoin it owns,10 then investors will see a growth in the amount of Bitcoin they indirectly own per share of MSTR. For example, MicroStrategy reported a year-to-date Bitcoin yield of 41.8% as of November 17, 2024.
This effect can work in reverse too, generating a negative Bitcoin yield if the company issues more MSTR shares at a lower premium to its BTC holdings or if outstanding convertible bonds are redeemed rather than converted into more shares of MSTR.
We don’t think buying MSTR for its “Bitcoin yield” is a sensible investing approach.
What do Bitcoin investors mean when they talk about using the ‘Power Law’ to estimate the return of Bitcoin?
Many Bitcoin investors believe that the price path of BTC is well described by a regression line fitted to the logarithm of time since BTC inception versus the logarithm of the price of BTC. Such a regression calls for BTC to appreciate about 40-50% or so over the coming year. We don’t believe that extrapolating future prices based on past prices (whether directly or after taking their logarithms) makes sense for most financial assets, and we are skeptical that it is a sound approach for estimating the expected return of BTC.
Have you ever seen anything like this before?
While no two situations are ever exactly the same, and this MSTR narrative is most definitely highly unusual, we have seen some similar situations over the years. The example that comes to mind most directly is that of the Grayscale Bitcoin Trust (ticker GBTC): a Canadian closed-end fund that held Bitcoin, and at its peak, had close to $30 billion of assets. At some point in 2017, the trust traded at 2.3x the value of the Bitcoins it owned. More recently, the trust traded at a significant discount, of as much as 50% during the first half of 2023. Many vehicles that lock up investor capital often trade at a premium to underlying assets to begin with, but in the longer-term trade at a discount. This is a typical pattern for closed-end funds, SPACs and many corporate holding companies.
The end-of-day trades that leveraged ETFs must execute, buying when the market goes up and selling when it goes down, is reminiscent of the algorithmic trading associated with “Portfolio Insurance” in late 1987. Portfolio Insurance flows are generally accepted as the proximate cause of the October 19th, 1987 “Black Monday” stock market crash. According to the Brady Commission, sales of $10 – 15 billion of equities created a downward spiraling, self-reinforcing feedback loop which ultimately resulted in the US stock market dropping 22% that day. While markets are much larger today than they were in 1987, the flows associated with leveraged ETFs (which tend to be concentrated in the final minutes of the trading day) could have a significant, destabilizing market impact.
What is your view of the MSTR-BTC premium in the future?
We will be surprised if MSTR is not at a discount in five years, particularly if the company follows through on its “21/21 plan” of issuing over $40 billion of stock and convertible bonds. Owning BTC in a corporate entity strikes us as less efficient than the ETF structure, as there will be capital gains tax liability on Bitcoin sold at a profit, and also the very real possibility of MSTR having to pay 15% tax on unrealized gains as part of the recent introduction of the minimum corporate tax rules.
Given your view of the premium going down over time, are you shorting MSTR versus buying BTC yourselves?
No, we’re not. For starters:
- Frictions are very high.
- We hate being short with unlimited downside, and in this case, the likelihood of getting squeezed out seems especially high.
- Given the return and risk characteristics of the trade, the optimal sizing would be too small to move the needle.
- We like the simplicity of being long-only investors in low-cost, highly-diversified index funds.
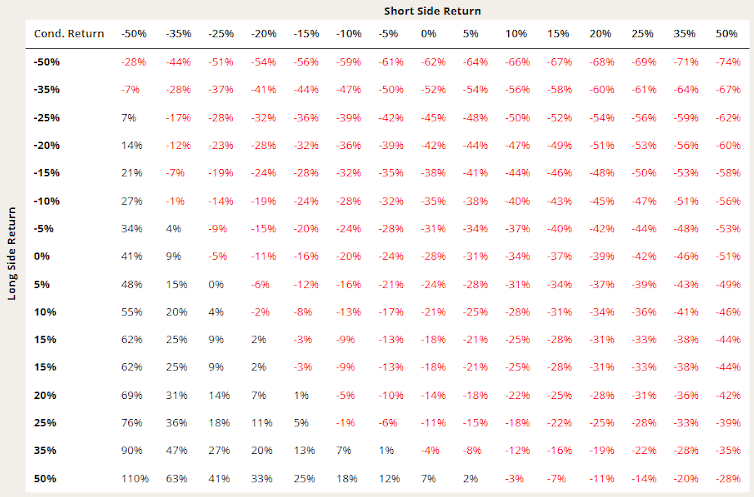
- It would be exciting if an ETF sponsor created a new long-short ETF that was long 1x Bitcoin and short 1x MSTR. Despite the convenience – and limited downside – of putting the long BTC vs short MSTR trade on via such an ETF, we would not invest in it. You can see why from the output of our Leveraged ETF tool below. The return pattern of such a long-short ETF is not very enticing at all, even with the assumption that MSTR underperforms BTC by 15% per annum.
Appendix: A few more examples of why people are buying MSTR, 2x leveraged long MSTR ETFs, and BTC11
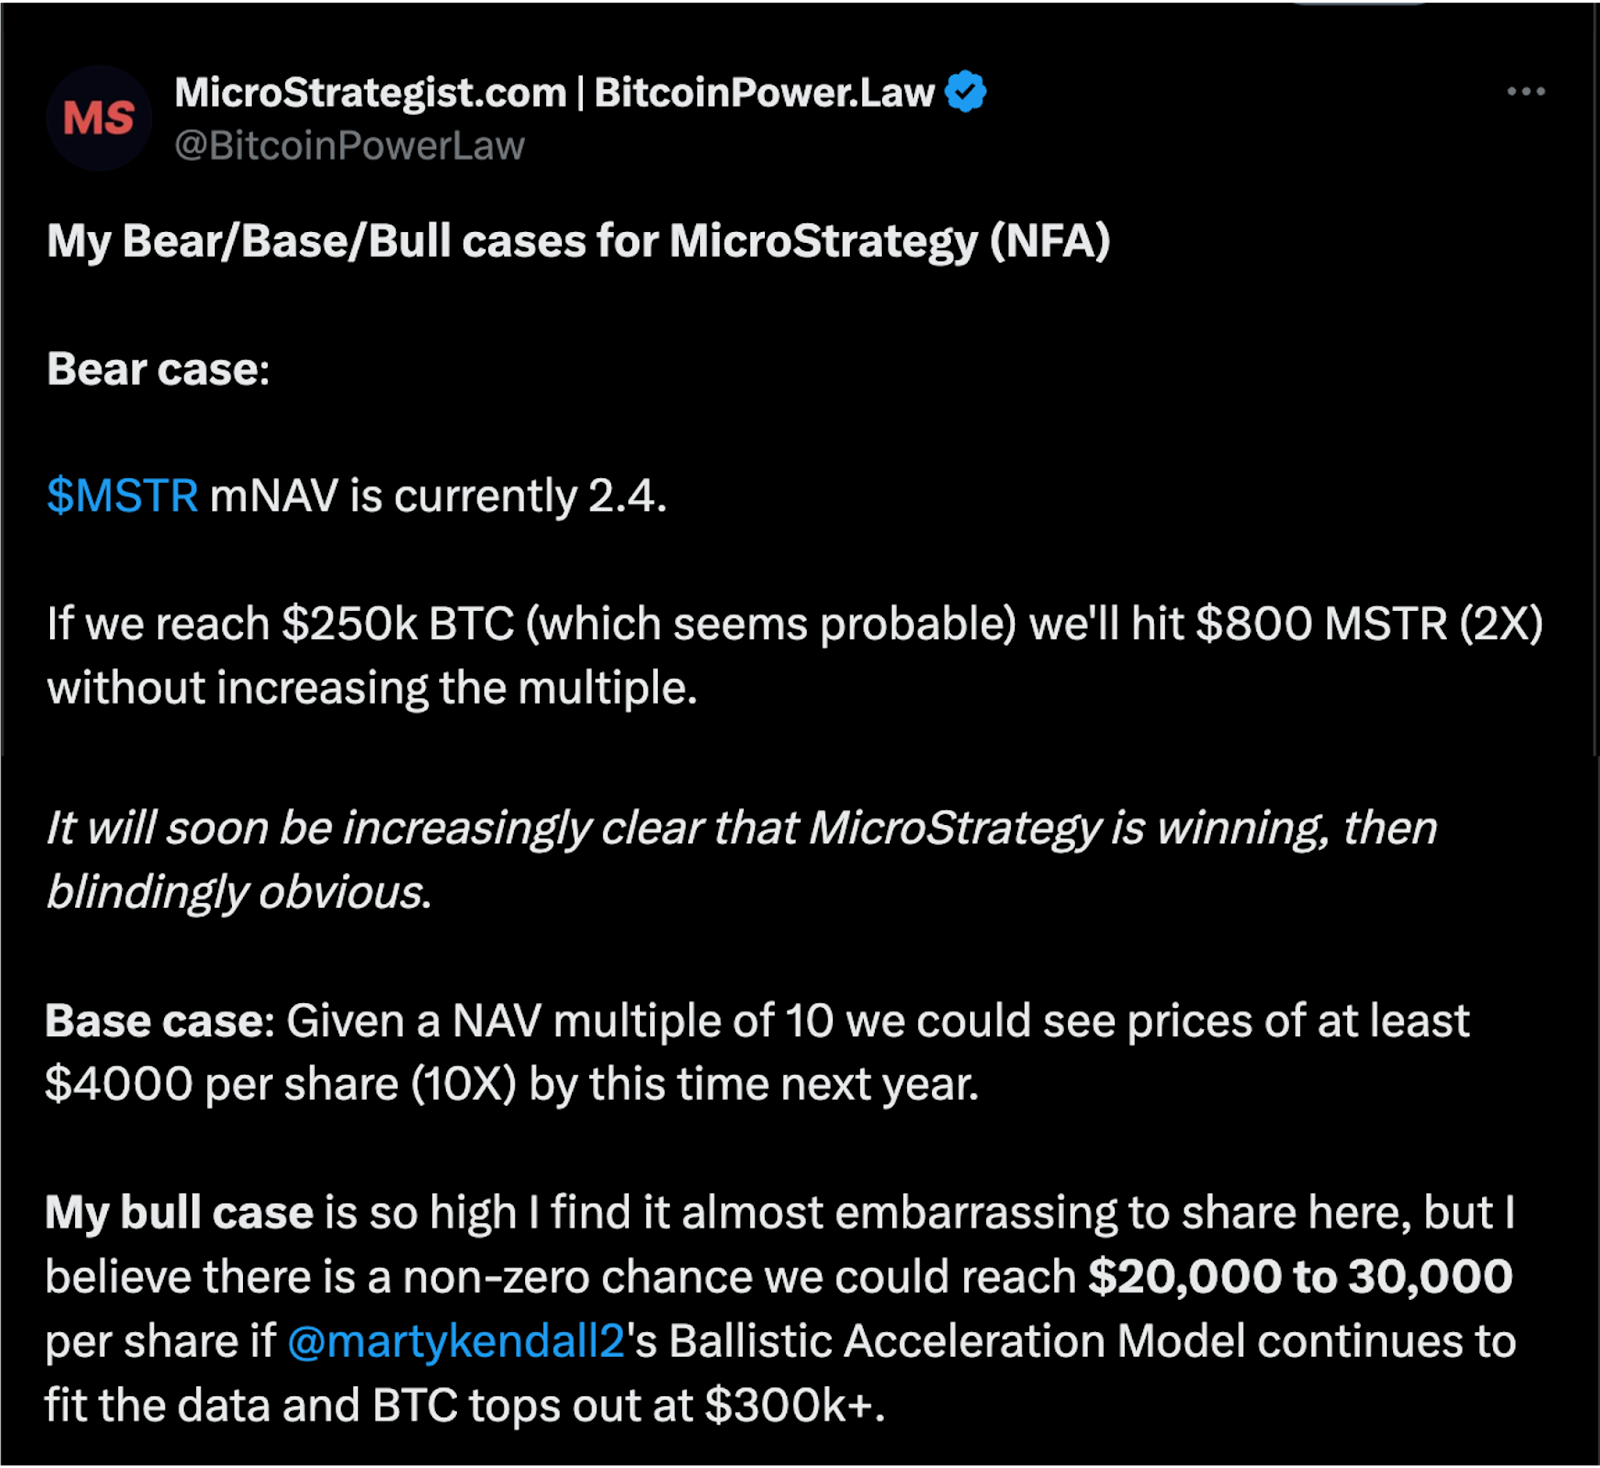
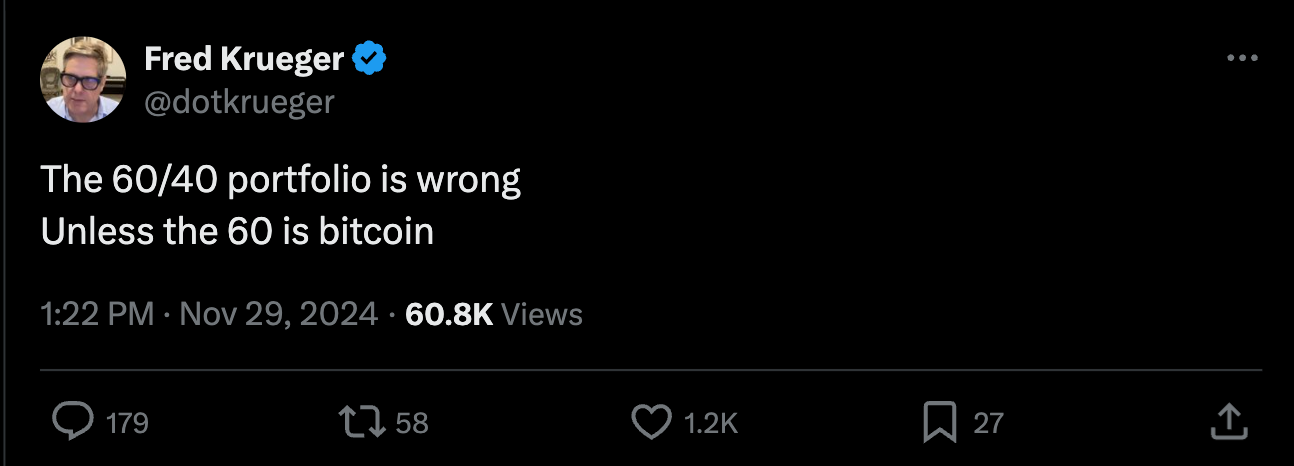
When Dan Hillery, a graduate student at Brown University, began investing in MicroStrategy in April, it accounted for about 40% of his portfolio. Hundreds of bullish options trades later, his returns have ballooned so much that MicroStrategy now makes up about 90%.
Hillery became familiar with options trading as an undergraduate, when he studied for quantitative finance tests in the hopes of landing a job at Citadel or Jane Street. “I never got hired at any of those places,” said Hillery, now 23. “So I ended up taking matters into my own hands.”
Hillery now holds a seven-figure position in MicroStrategy after scoring a 1,300% return in the past three months. He said he believes in the company’s long-term prospects but may consider selling some of his shares down the line.
Rajat Soni wasn’t able to purchase crypto directly with the pension fund he received after leaving his job as a fixed-income analyst at TD Bank. The 32-year-old from Toronto fully invested the money in bitcoin exchange-traded funds instead. Then he went down the MicroStrategy rabbit hole.
“Once you see it, you can’t unsee it,” Soni said of MicroStrategy founder Michael Saylor’s vision to turn his company into a bitcoin buying machine.
In August, Soni moved his entire pension fund into MicroStrategy. He has also dabbled in…an ETF that aims to provide double the daily return of MicroStrategy shares…
Soni said he has scored a 200% return on the stock in about seven months. MicroStrategy now makes up about 40% of his entire portfolio, and bitcoin about 60%. He said TD Bank is his only other investment — he was issued some shares as an employee. “If I could, I would dump it for MicroStrategy,” he said.
- Thank you to our friends Andy Constan, Dave Blob and Samir Bouaoudia for doing their best to help us think clearly about this fascinating topic. As always, we thank our colleagues Jerry Bell and Steven Schneider for making the whole process of publishing research fun and fast.
- With adjustments for convertible bonds outstanding, but unadjusted for potential corporate capital gains tax liability.
- This is shown in the tool’s full output, though not in the summarized output we show above.
- It is possible that the ETF manager would intervene before the value of the ETF hits zero, but we would expect the value of the ETF at the end of such a day to be close to zero, and likely on the path to full liquidation and return of any remaining capital to investors.
- Specifically, we chose the union of the top 1000 stocks as of 1995, 2005, and 2015, and filtered slightly to ensure good data quality.
- To see why this is true in a simple random walk without drift, note that for every path that finishes below the level at the end of the period, there is another path where it hit the level and then followed a path that was a mirror of the path that finished below the level. So, for every path that finished below the relevant level (here a 50% drop), there’s another path that touched the level but then reflected and wound up above the level at the end.
- This was discussed in greater detail in this WSJ article from December 2nd, 2024.
- Not including the volatility drag from rebalancing, but just adding up the daily “miss” vs 2x MSTX.
- From these two WSJ articles, here and here.
- The calculation usually assumes that the convertible bonds will be converted into equity when they mature, which assumes MSTR stock will appreciate over the life of the convertible bond.
- Taken from the same WSJ articles previously referenced, and also from X.

 Previous