September 26, 2024
Featured Insights
When a Crystal Ball Isn’t Enough to Make You Rich
By Victor Haghani, James White and Jerry Bell 1
Estimated reading time: 10 min.
Introduction: Back to the Future
In the 1989 blockbuster Back to the Future II, time travel enables Michael J. Fox’s nemesis, Biff, to become a gazillionaire by bringing an almanac with sports match outcomes back from the future. We thought it might be instructive, and certainly entertaining, to make a less fanciful version of this dream a reality – for a few lucky people.
In November 2023, we ran an in-person, proctored experiment involving 118 young adults trained in finance. We called the experiment “The Crystal Ball Challenge.” We gave each participant $50 and the opportunity to grow that stake by trading in the S&P 500 index and 30-year US Treasury bonds with the information on the front page of the Wall Street Journal (WSJ) one day in advance, but with stock and bond price data blacked out. The game covered 15 days, one day for each year from 2008 to 2022.
You can play this game for yourself here: Crystal Ball Trading Challenge – though without the pecuniary component. As of the time of writing, over 1,500 people have tested their skill and luck by playing the game on our website.
Summary of results
The players in the proctored experiment did not do very well, despite having the front page of the newspaper 36 hours ahead of time. About half of them lost money, and one in six actually went bust. The average payout was just $51.62 (a gain of just 3.2%), which is statistically indistinguishable from breaking even. The poor results were a product of: 1) not guessing the direction of stocks and bonds very well, and 2) poor trade-sizing. The players guessed the direction of stocks and bonds correctly on just 51.5% of the roughly 2,000 trades they made. They guessed the direction of bonds correctly 56% of the time, but bet less of their capital on bonds than on stocks (if you’re planning a career as a proprietary macro trader, consider putting your focus on bonds).
Perhaps the front page of the WSJ isn’t a particularly clear crystal ball, or our players weren’t very adept at reading it. As former Goldman Sachs CEO Lloyd Blankfein reminded us in a widely-circulated tweet, sometimes the markets don’t react to the news as even seasoned experts expect – an important lesson all successful traders learn, eventually.
It didn’t help that the players also did not seem to know how to size their bets well. On eight of the 30 trading opportunities,2 the players in aggregate displayed 2-to-1 odds of being correct in their bets, but they did not bet more heavily on those occasions. Overall, they did not display trade-sizing that bore any relation to their propensity to guess the price moves of stocks or bonds correctly.
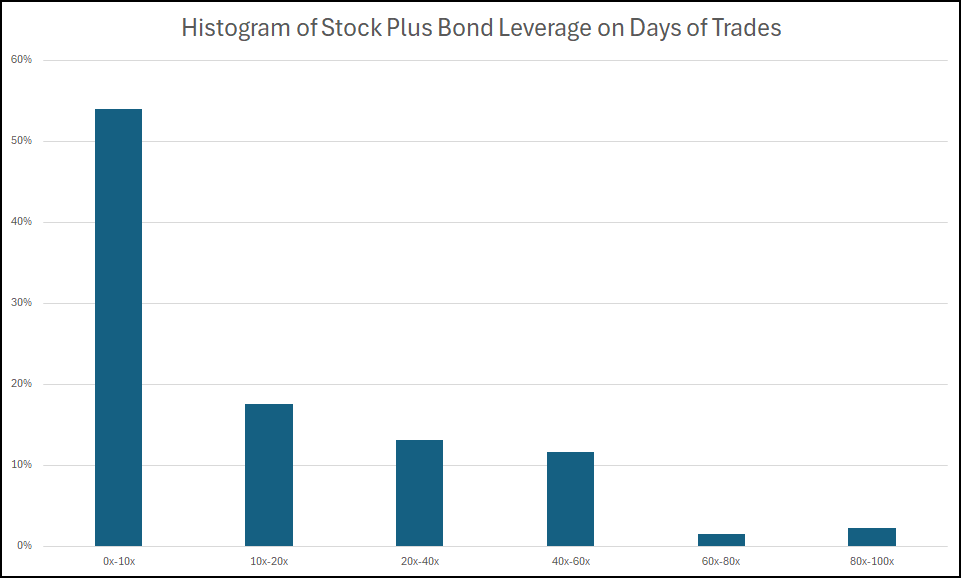
Many of the players used excessive leverage relative to their exhibited edge in guessing market direction. On about 30% of the total number of days on which players traded, they used leverage of greater than 20x capital. On 4% of the total occasions, they used leverage of 60x or higher, which carried a very high probability of being wiped out if they guessed wrong. In sum, there was little discernible logic or rationale to their trade-sizing decisions.
See Appendix I for a detailed analysis of player results.
Perhaps this excessive risk-taking by some of the players is partially explained by the finding that most investors tend to overestimate the predictive value of news on market outcomes. For example, a recent survey of 11,000 investors by Andre et al.3 found that about 70% of investors (but not finance academics) believed that stale, four-week-old, good (or bad) news was predictive of high (or low) future stock returns.
However, our sample of 118 staked and proctored players did better than the roughly 1,500 people who have played the game for fun on our website. The median outcome among these players was a loss of about 30% of their capital. Only 40% finished with a profit, and 36% went bust.
We were tickled to see that six players devoted themselves to achieving the maximum possible payout, growing their initial wealth 70,575-fold. They did this by repeatedly playing the game to see what stocks and bonds did on each day, and then using that information to put up the perfect score by correctly betting the maximum size on each trade. We were elated to see our game spark so much passion in some players!
Some of the world’s best traders show how to do better
We invited five seasoned and successful macro traders – four men, one woman – to play the game, with markedly better results. This was a very select group of traders: head of trading at a top-five US bank, founder of a top-ten macro hedge fund, senior trader at a top-ten macro fund, former senior government bond trader at top-three US primary dealer, and former senior Jane Street trader.
These players all finished with gains. On average, they grew their starting wealth by 130%, with a median gain of 60%. All of the players were selective and highly variable in their trade-sizing. They did not bet at all on about 1/3 of the trading opportunities, but bet big on days when they presumably felt confident in the impact of the news on stock or bond prices.4
These veteran traders predicted the direction of the markets significantly better than our 118 younger, less experienced participants (63% vs 51.5%), but mostly we ascribe the dramatically different results to the much more rational trade-sizing displayed by the experienced traders. One important conclusion we reach is that there is little value in this crystal ball without sensible trade-sizing.
Motivations
In addition to our curiosity in testing Taleb’s hypothesis, we had four further motivations for conducting this experiment:
- We are deeply interested in learning how people approach the sizing of attractive investment opportunities, having researched and written extensively on this topic. In 2016, we conducted an experiment (also involving financial rewards) where we invited participants to bet on a digital coin flip that was programmed to have a 60% probability of landing on heads, and published our findings in “Betting on a Biased Coin.” We recently wrote a book, The Missing Billionaires: A Guide to Better Financial Decisions, that is focused on investment sizing.
- We wanted to quantify the value of macro-economic information. How often would people guess the direction of markets from the information on the front page of the WSJ?
- We hoped that the tool we developed for the experiment could be productively used to educate and train professional risk-takers.
- It was going to be a lot of fun!
The Game
Over 90% of the participants were in graduate programs in finance or MBA programs with finance modules at four east coast US universities with low admission rates. The participants were not told in advance that they’d be invited to participate in this experiment. Any who did not want to participate were allowed to leave (though no one did).
Here’s how we explained the rules of the game:
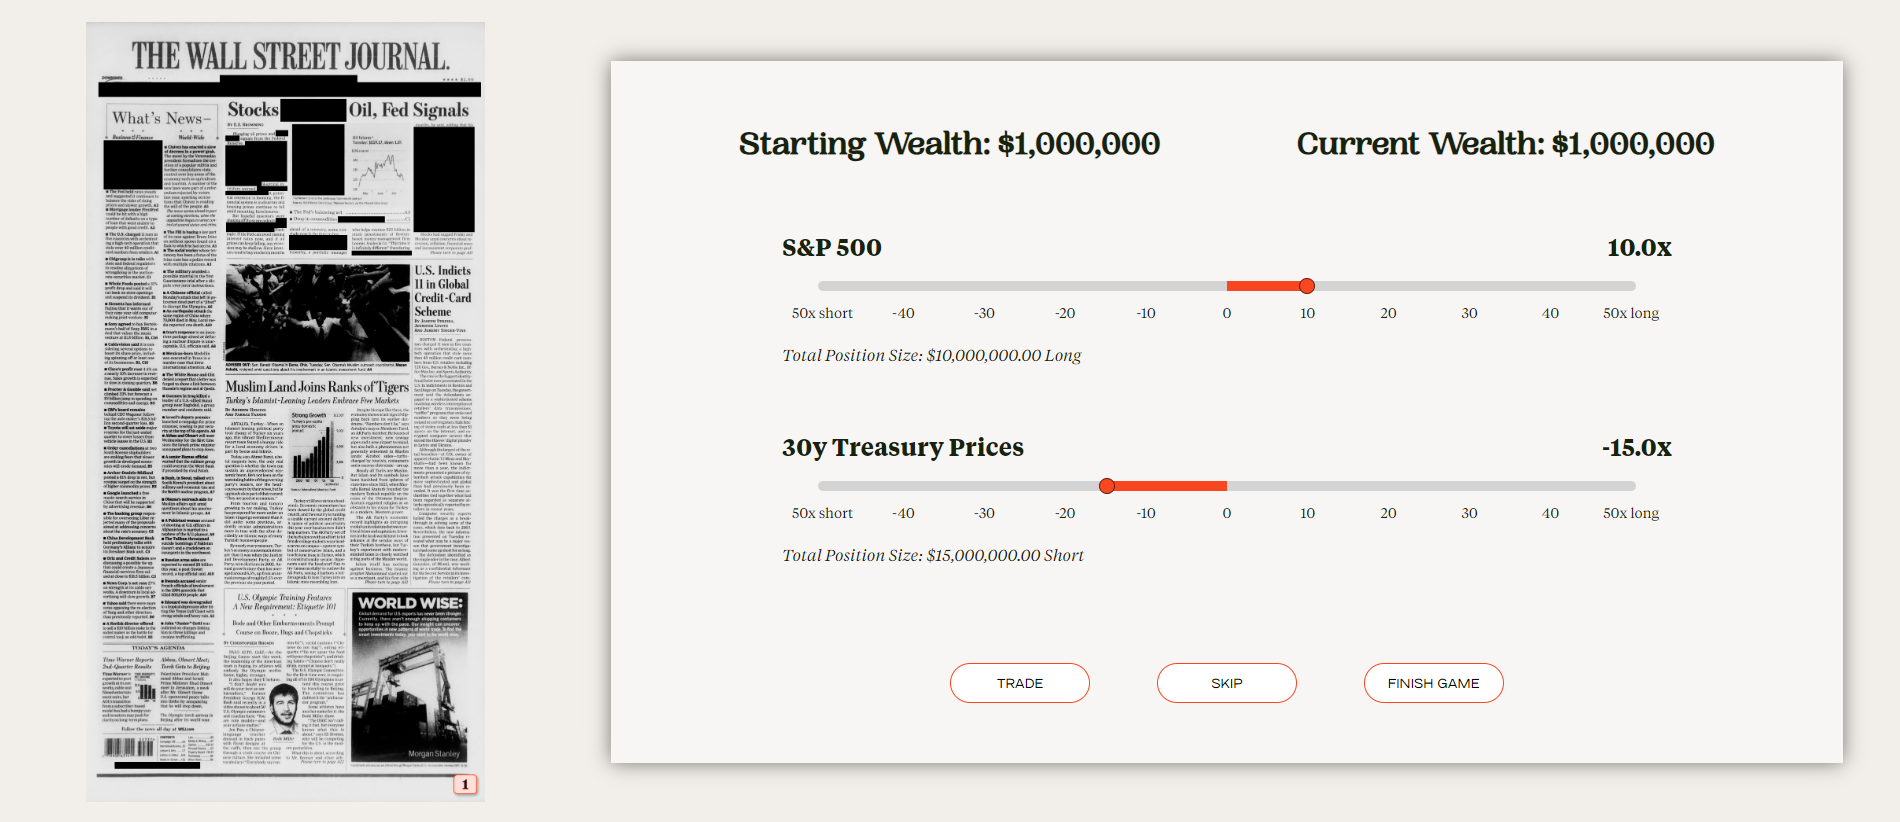
We are giving you $50 to play our “Crystal Ball” game. The object is to see how well you can do trading stocks and bonds if you know the news from the front page of the WSJ one day in advance. In other words, you’ll be in that dreamed-of position of being a trader who “knows the future.” For example, you will be shown the front page of the WSJ for a Wednesday, and be able to take a long or short position in the stock market and in the bond market at prices prevailing at Monday’s close (that is, two days earlier). Your trades will be liquidated at Tuesday’s closing prices. Note, on each front page we’ve blacked out anything that tells you explicitly what market prices actually did that day – leaving that information in would make this game too easy and no fun at all!
You will be trading the S&P 500 stock market index and a 30-year US Treasury bond futures contract, and you can use as much leverage as you’d like to, up to 50x. Use the sliders to choose the positions you want and then click the “Trade” button. Remember that for the 30-year Treasury bonds, prices go down when yields go up, and you are trading on price.
You are starting off with $50 of bankroll, and we will pay you however much this has grown to, or shrunk to, with a maximum payout of $100. You will have 45 minutes to play the game.
We have not chosen these days to try to trick you – they are randomly chosen. You will be able to trade on 15 different days, once per year over the past 15 years. The days will be presented to you in a randomized order. We’ve chosen these days randomly from a set of days where one third of them are days of employment reports, one third from days of Fed announcements, and the other third purely randomly, all taken from days that are in the top half of days ranked by overall market volatility. You can use the “Skip” button to skip any day you don’t feel like trading, and you can trade stocks, bonds, or both, each day. You can use the “Finish” button if you want to stop before being presented with all 15 days. Leverage of 1x means your position size is equal to your capital size. There are no transaction costs or overnight financing costs or rebates on your trades.
Good luck, and have fun – you may never have this opportunity again!
Below are two pictures of the screens that players engaged with. In the first screen, the player can expand the picture of the front page of the WSJ on the left to be able to read it more clearly, then revert to the trading page.
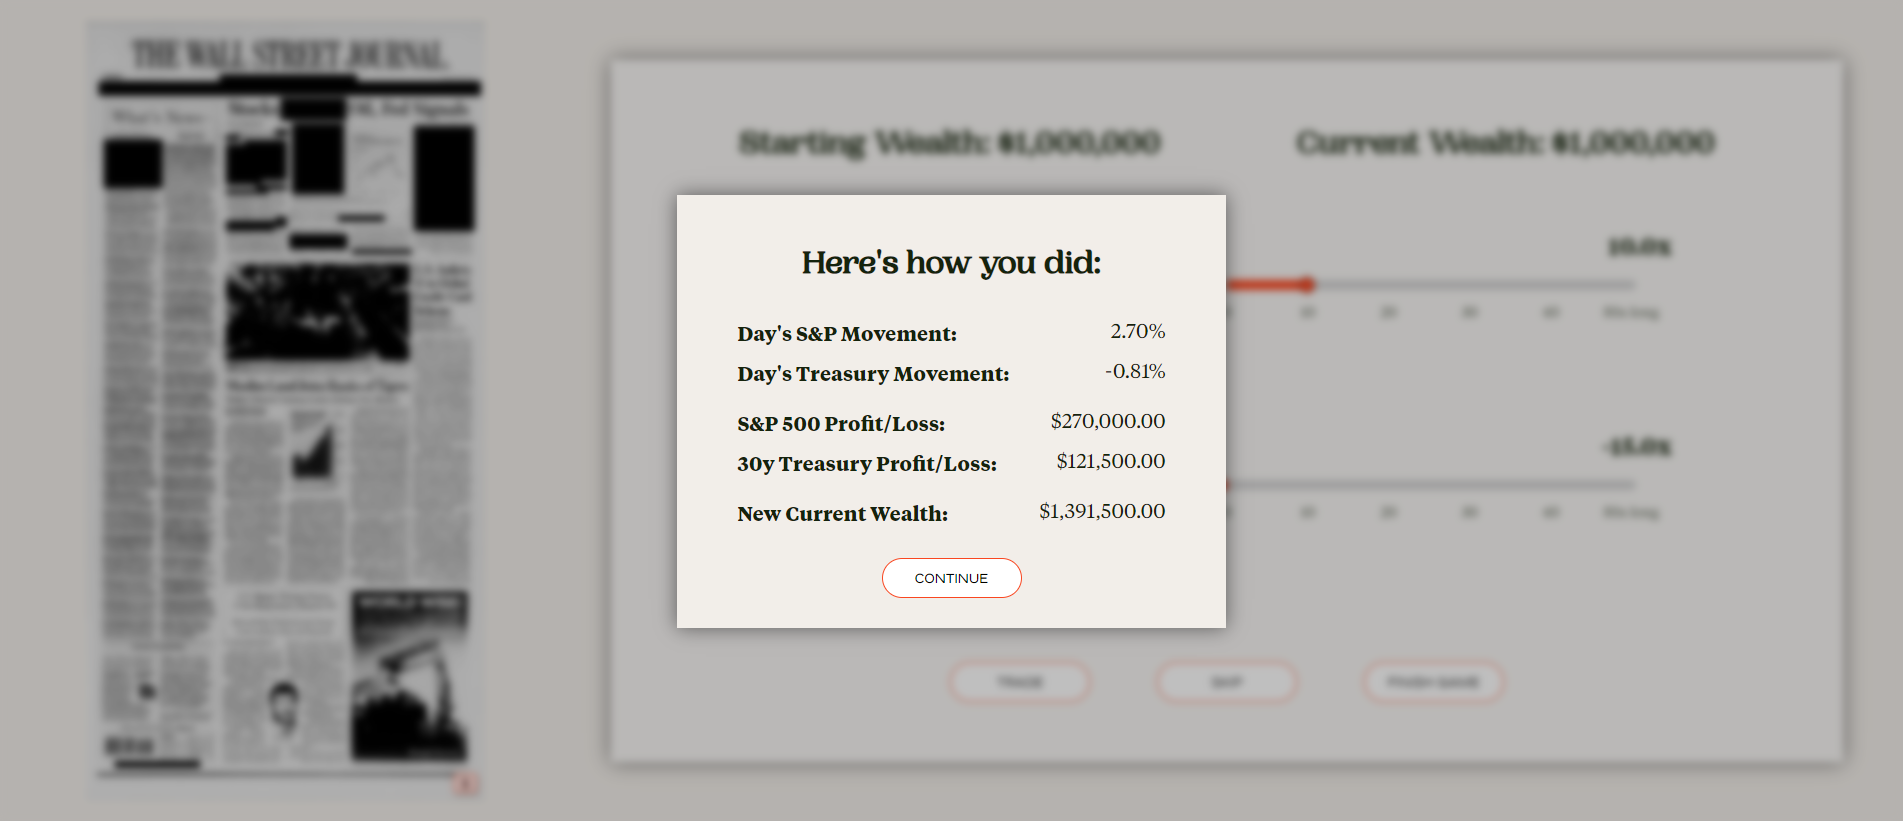
Then, after clicking “Trade” the result of the trade is revealed, showing the market move in stocks and bonds, and the resultant profit or loss. The player’s bankroll is expressed based off of a starting value of $1 million, but the players understood that their payout would be $50 times the ending wealth divided by $1 million, with a minimum of $0 and a maximum of $100.
All the front pages can be seen here, in chronological order: https://elmwealth.com/crystal-ball-gallery/
Conclusion
“He who lives by the crystal ball will eat shattered glass.” — Ray Dalio
Was Taleb correct in his conjecture that “If you give an investor the next day’s news 24 hours in advance, he would go bust in less than a year”? While our experiment didn’t test his statement precisely – we only gave players 15 days of front pages, players were risking just $100 in the game, etc. – by and large we think Taleb is right. His counterintuitive proposition is both insightful and instructive.
The financial industry is replete with individuals and organizations constantly working to develop their own proprietary crystal balls. We hope that the experiment and results described herein convince crystal ball makers that sensible investment-sizing is essential to realizing the value of what they are trying to build.
The poor aggregate showing of our 118 financially-trained participants highlights the importance of educating young, aspiring finance industry professionals in decision-making under uncertainty, and particularly the theory and art of investment-sizing. We hope our Crystal Ball game will be a helpful tool – or a prototype for a better one – that educators and financial firms can use to teach these concepts and skills. Perhaps it may even become part of the hedge fund boot camp training programs at Citadel, Point72, Balyasny, and Jane Street that have been in the news recently.5 The uniformly positive results of the five experienced macro traders we invited to play the game suggest that there are teachable skills involved in successful discretionary investing.
Perhaps Matt Levine foresaw the results of our experiment with his article titled: “Knowing the Future Isn’t That Helpful.”6 He describes a delightful academic study that analyzed the trading results of a cartel of investors with an excellent, albeit illicit, crystal ball.7 The traders bought earnings announcements before they were released from an international hacker group that illegally obtained access to the servers of three commercial newswire companies. These traders were sophisticated and their crystal ball was gem quality, but their batting average was far from perfect – though it was still good enough to make a decent return on their capital…before they were caught by the SEC!
Most stories involving people seeing into the future, like that of the trading cartel above, don’t have “happily ever after” endings. There are usually unintended consequences that come with perfect prescience – a reminder that even prophets can’t escape risk and uncertainty. The best we mortals can do is make our decisions with a framework that explicitly accounts for the presence of risk in just about every big choice we face.
If you haven’t already, you can play the game here: Crystal Ball Trading Challenge
Appendix I: Detailed Analysis of Player Results
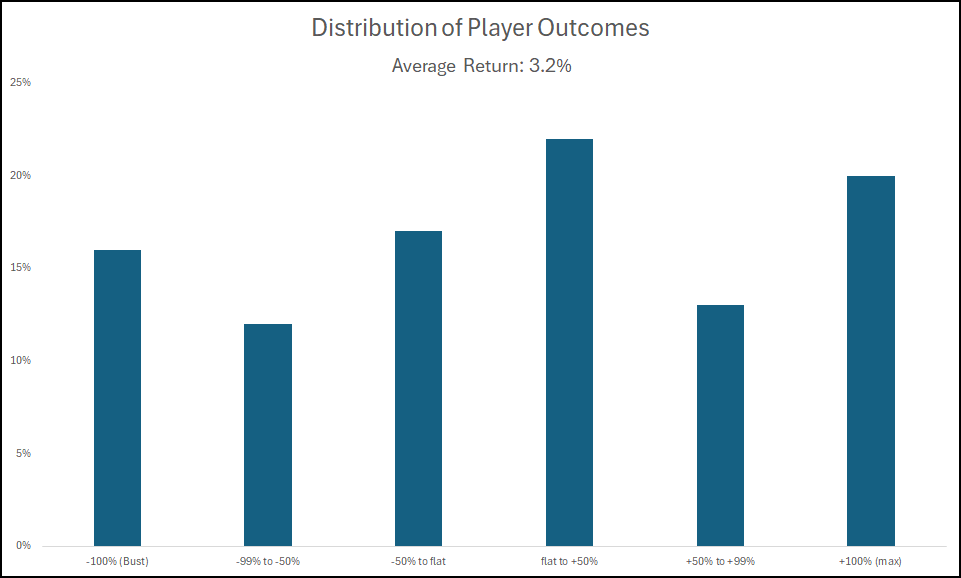
Below is a chart showing the distribution of payouts to the players. The average payout was $51.62 per player, representing a weighted average return across all the players of 3.2%.8 About half (45%) the players lost money, and 16% went bust, about the same as the 20% that maxed out at $100. We suspect most readers will agree with us in rating this performance “not very impressive.” It seems that getting the front page of not-any-old-newspaper, but the WSJ, 36 hours ahead of time (albeit with market moves redacted) may not be as valuable as many of us might have imagined.
An experienced market participant is likely able to extract more information from the front page of the WSJ than someone with less experience, such as the participants in our experiment. Even though direct reporting of market moves was blacked out, journalists often report the news biased by how markets reacted after the news. For example, they’ll refer to an employment report as “weak” if the bond market rallies after the report, even if the actual report is more ambiguous – for example, a slightly low number of jobs created, countered by a drop in the unemployment rate and a rise in hourly earnings.
The players forecast the correct direction of stocks and bonds 51.5% of the time. With stocks, they got the correct direction on 48.2% of their trades, and on 56.2% of the bond trades. Notice there were four days where more than 70% of the players forecast the correct direction of the market, and 10 days when more than 60% were correct. However, the players placed 40% more trades in stocks than bonds, which is unfortunate given the players had a better realized edge with bonds than stocks. The table below describes each of the 15 trading opportunities and shows how many trades the players placed on each of the days and what percentage of the trades were placed in the correct direction: long when the market went up and short when it went down.
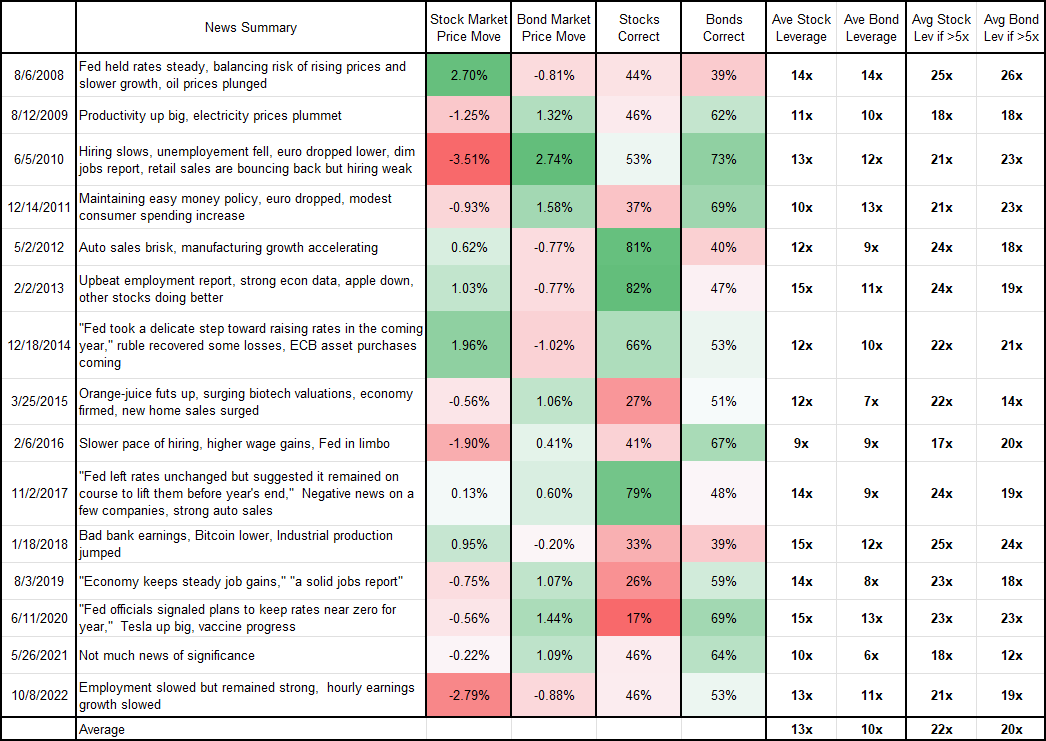
The next table puts the focus on trade-sizing. It shows the average leverage used for each trading day for stock and bond trades, and also the averages conditional on being higher than 5x leverage. Average leverage used in stock and bond trades was 13x and 10x respectively, and two times as much – 22x and 20x – for trades where leverage was greater than 5x.
We calculated the correlation of leverage (i.e. trade size) for each day versus the win percent for each day, and found a zero correlation in the case of stock trades and a -0.1 correlation for bond trades, along with a +0.2 and -0.1 conditional on leverage used being greater than 5x. It seems that our players on average did not follow a strategy of placing bigger trades on those that they had a higher probability of getting right. Perhaps this is due to them not knowing which ones they had a higher probability of getting right, or perhaps they were not following a disciplined sizing strategy.
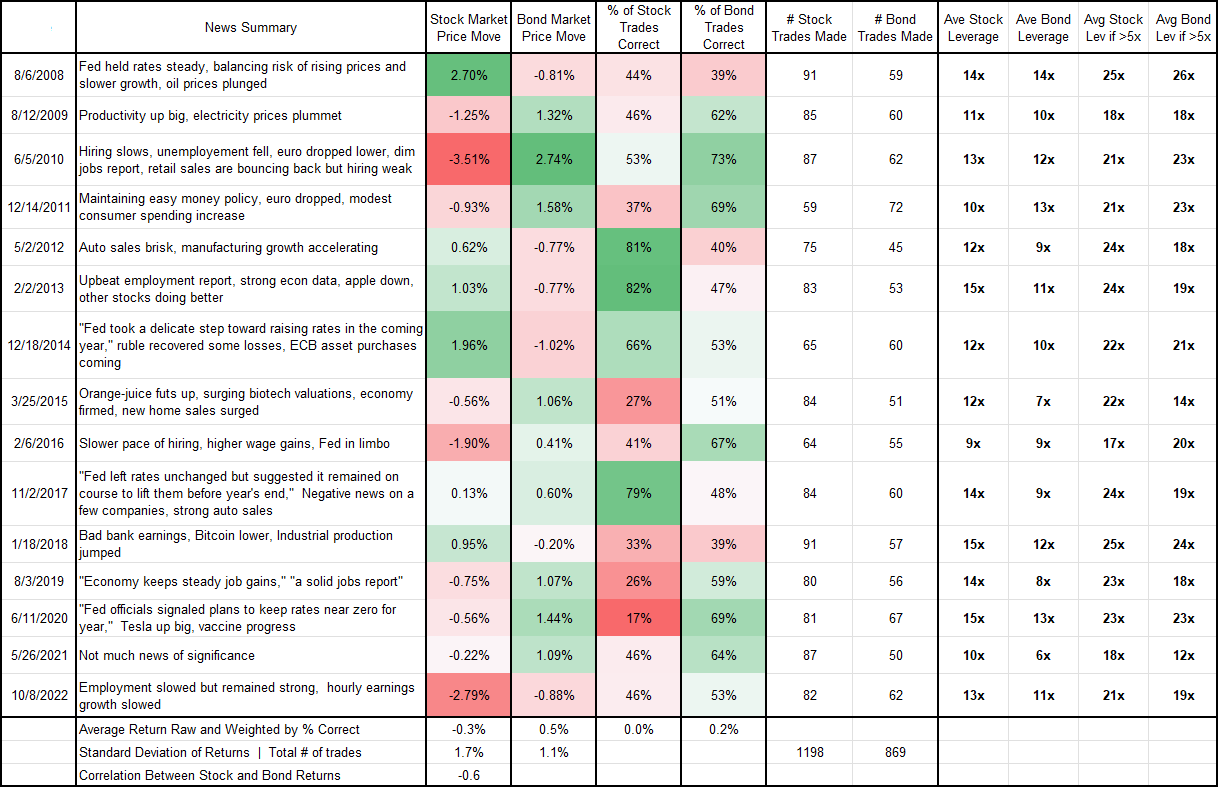
The players traded 2,067 times, for an average of about 18 trades per player. The maximum number of trades each player could have made is 30, which would entail doing a stock and bond trade for every front page. Some of the 40% shortfall versus the maximum number of trades is due to 16% of the players going bust, but most of the shortfall is from players abstaining from trading opportunities.
Players were more apt to take long positions in stock and bonds; they traded stocks 62.5% of the time as a long position, and 59.6% of the time for bonds. About 10% and 8% of the players were long stocks and bonds, respectively, for every trade they made.9
Unpacking player performance
What accounts for the underwhelming 3.2% return of the players? The fact that our players guessed the direction of stocks and bonds correctly only 51.5% of the time seems to be a pretty big handicap to overcome. It seems the front page of the WSJ wasn’t a particularly clear type of crystal ball for our players to read, and/or they weren’t very good at reading it.
However, even with their weak ability to read the tea leaves, the players could have done quite a bit better if they applied a sensible and constant amount of leverage to all their trades. It would have been reasonable for the players to have estimated the daily standard deviation of stocks and bonds, given our description of how we chose the 15 days, at around 1.5% – 2% for stocks and 1% – 1.5% for bonds. They might have then considered that there could easily be a two or three sigma event in the sample, and so the maximum amount of leverage they could use with a low likelihood of being wiped out might have been 8x for equities and 12x for bonds, if betting on both at the same time.
With that maximum leverage in mind, the next step would be to find the optimal size, subject to the maximum constraint above, given their view of the expected return and risk of the trades.10 One reasonable choice would have been to apply the Kelly criterion. While the implicit risk-aversion embedded in the Kelly criterion is lower than most people’s risk-aversion with regard to their total wealth, it is reasonable to use it here given the amount of money involved was small relative to the players’ total wealth.
If the players felt they had a 55% chance of being right (an overestimate, as it turned out), that would have suggested something like 6x leverage for stocks and 8x leverage for bonds,11 assuming profits on these trades would be uncorrelated. The optimal size would be a bit lower assuming some positive, but not perfect, correlation in trade outcomes.
If the players had all changed their trade-sizing such that they leveraged all their trades as suggested above (6x for stocks and 8x for bonds), they’d have generated an average return of 10%. Another sign that this is better sizing of trades is that outcomes amongst the players would have had about 45% less dispersion: only 4% of the players would have lost more than 50% of their stake, compared to about 28% in the actual trial. None would have lost more than 75%, and hence, none would have gone bust – recall that 16% of our participants did just that. So, the participants in aggregate would have done better with more reasoned trade-sizing, particularly on the downside…but not tremendously better (and we’d have been 7% more out-of-pocket).
The actual leverage used by participants was, on average, much higher than 6x and 8x for stocks and bonds – generally, people tended to use more leverage in their stock trades than in their bond trades, which is inconsistent with stocks being more volatile than bonds combined with their ability to forecast stock movements being weaker than their skill in guessing bond movements.
As can be seen in the chart below, on about 30% of the days that players traded, they used leverage greater than 20x, and on 4% of the days, they used total leverage of 60x or higher. And on 17 occasions – just over 1% of days traded – players went for 100x leverage, which exposed the player to close to a 50% chance of total loss of capital. It seems clear that there was a fair amount of over-sizing of trades.
However, a much bigger improvement could have been attained from the players doing a better job discerning when they had a more accurate reading of the future. If they’d scaled their trades bigger when they were more likely to be right, they’d have done much better, but it’s hard to know if, on the days when a high percentage of players put on the correct trades, if they really did have a stronger conviction that they were going to be right. It was clear which days were employment and Fed announcement days, and it turns out that the players were more accurate in their readings for bond movements on those days with a 58% hit ratio, while on the other third of the days they only had a 50% hit ratio.
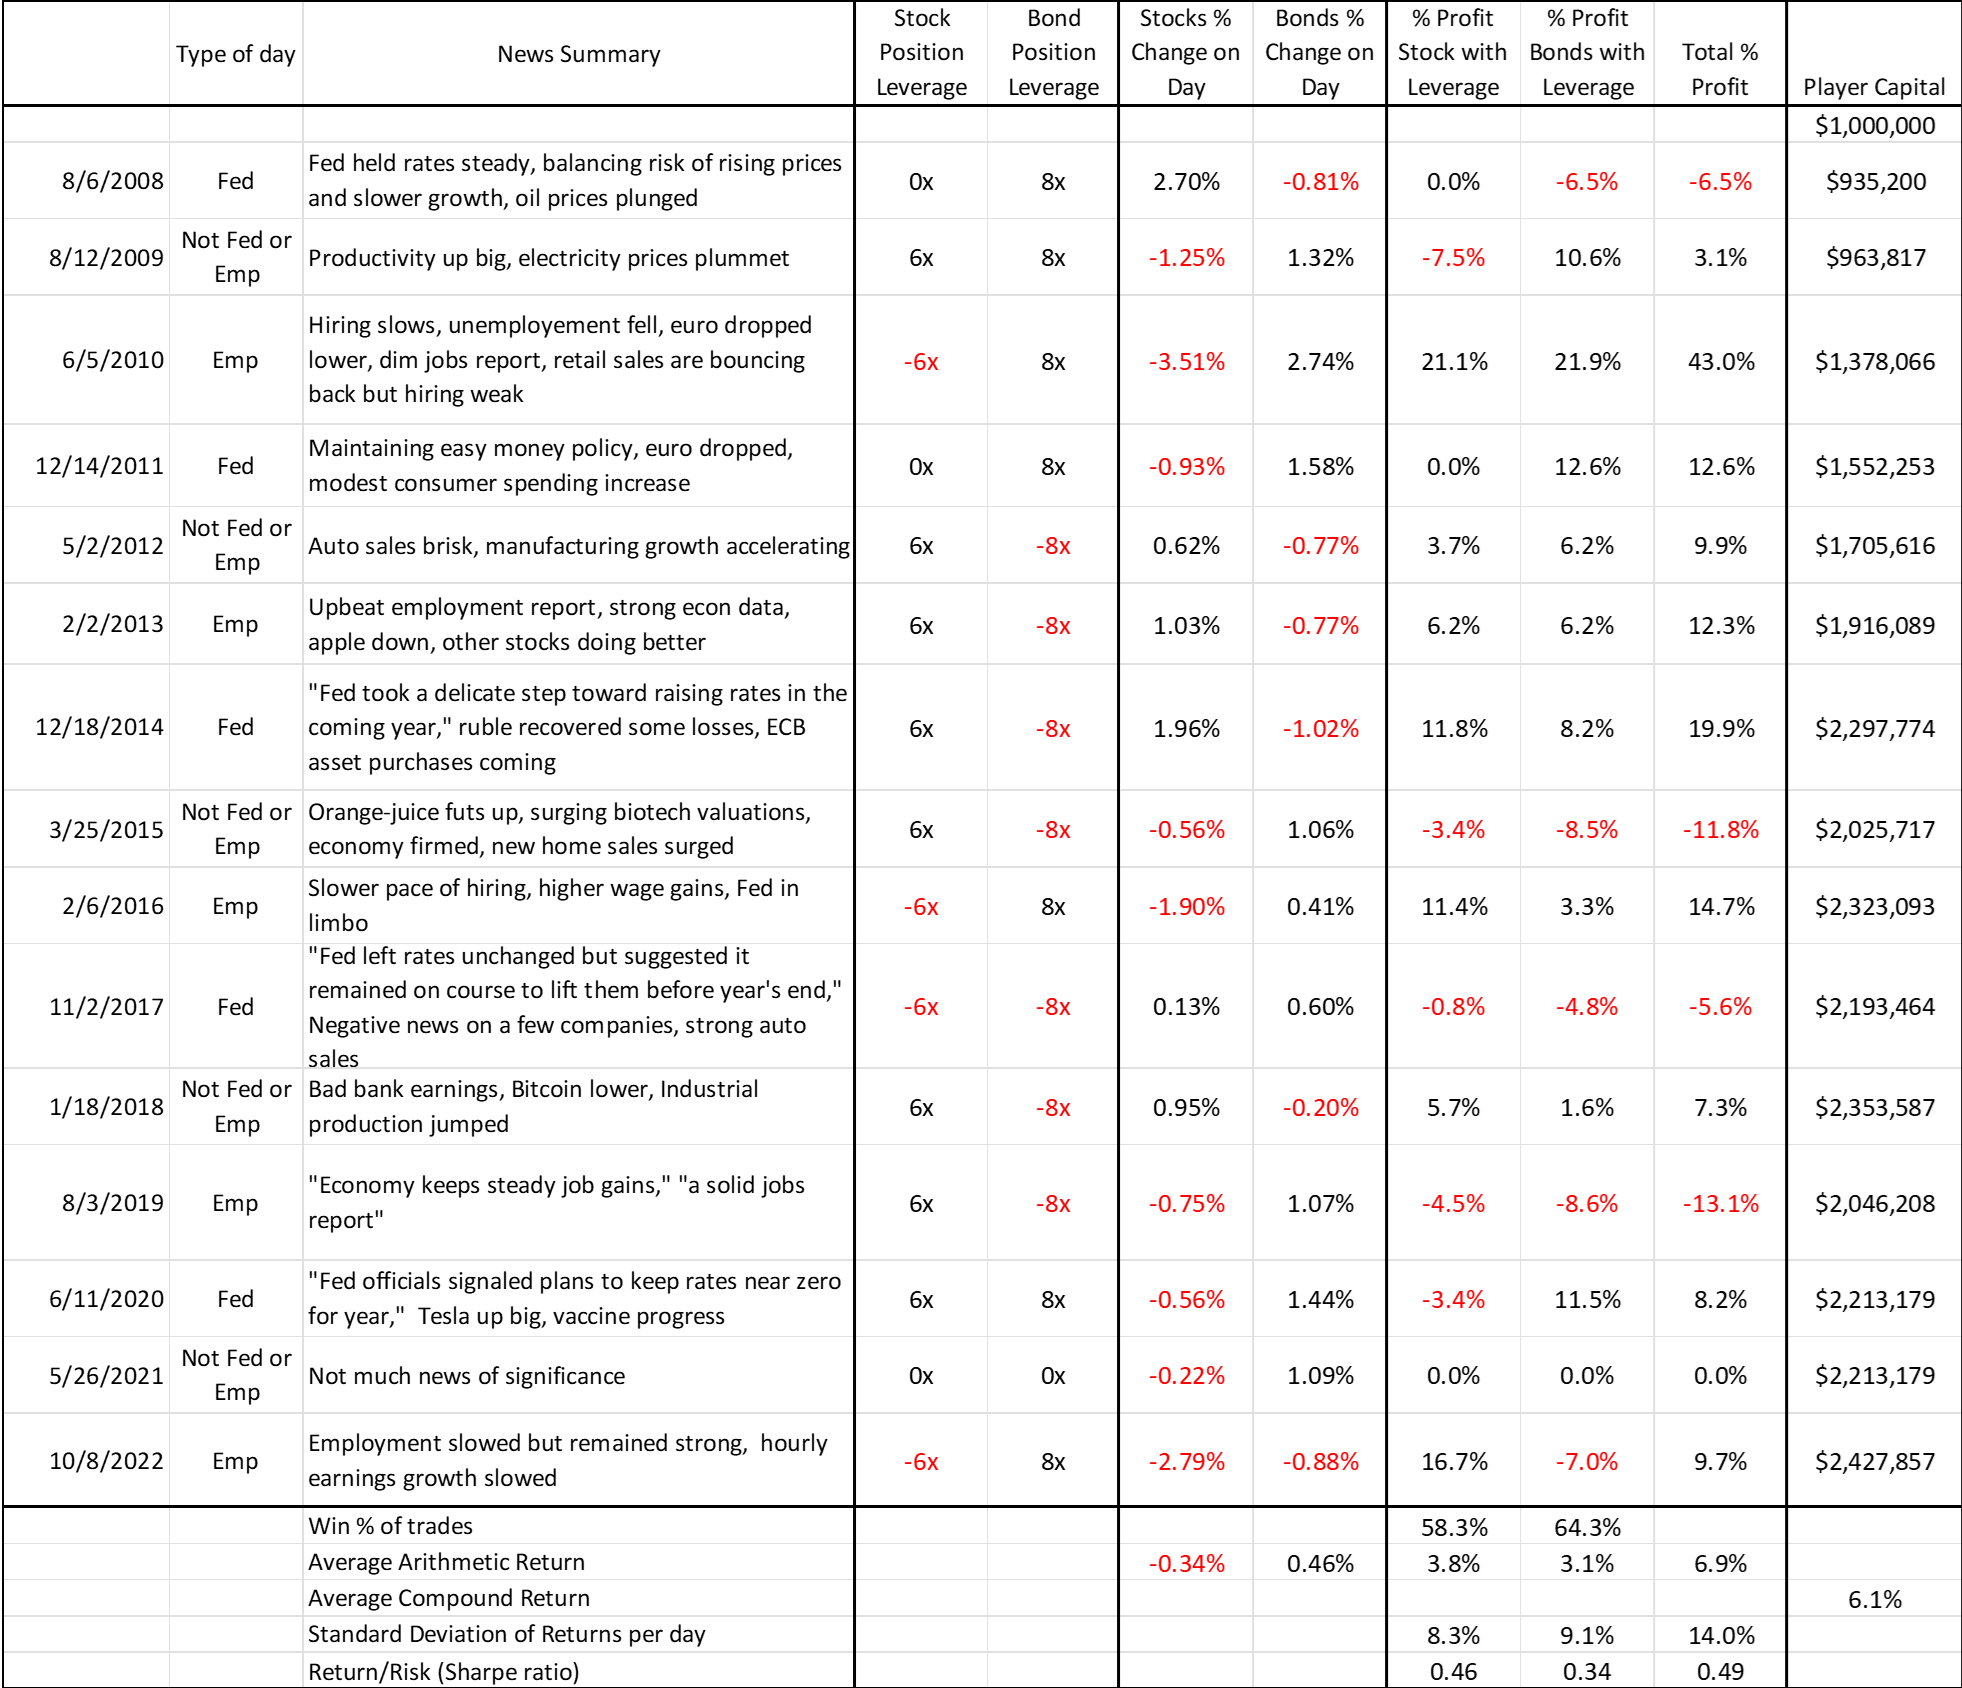
The players also could have done much better if they had based their forecasts on a simple set of rules around the news that was on those front pages. They’d have been correct about 60% of the time if they had shorted bonds whenever the balance of news items was in the direction of a stronger economy, higher inflation, higher energy prices, a stronger Euro or a less accommodating Fed, and vice versa for the opposite news. For stocks, players also would have been correct about 60% of the time if they went long stocks when the balance of news items was in the direction of stronger economy, lower inflation, higher energy prices, a stronger Euro or a more accommodating Fed, and if they went short stocks when the balance of news items was in the opposite direction. There were several days when there was no news of the above variety or there were an equal number of news items on each side of the ledger. In those cases, abstaining from trading would have been a sensible decision.
The table below shows the results from applying the simple trade decision rules described above for direction and sizing. This approach had a success rate of 58% for stocks and 64% for bonds, resulting in an average 6.1% return on each trading day and a 2.4x growth of the bankroll.
As a further test of our hypothesis that this Crystal Ball would bear fruit for players with more experience in connecting news to markets and in sensible trade-sizing, we had five senior bank and hedge fund traders play this game.12 Their average end wealth was 2.3x their starting wealth, ranging from 1.2x to 5.6x. None went bust, and their average trade success ratio was about 63%. As was the case with the main sample of players, these experienced traders also did substantially better with bonds (71% correct) than with stocks (56%).
Appendix II: Putting a value on the crystal ball
How much should an investor be willing to pay for a crystal ball that gives them the front page of the WSJ one day in advance, on 15 high-volatility days? In general, when investors are allocating their capital to attractive opportunities with optimal sizing, the risk-adjusted return they are expecting to earn is roughly one half of the expected return.13 Let’s say that, when we do a trade, the average expected return to risk ratio of the trades is 0.2. This is twice as high as we were suggesting for our participants, and consistent with a 60% chance of getting the direction of the market correct.
For an investor with a typical degree of risk-aversion,14 he should risk 10% of his capital on a one standard deviation outcome of such a trade, assuming the trade is uncorrelated with the rest of his investments.15 His expected return on the trade is then 2% (0.2 * 10% = 2%), and his risk-adjusted return is about 1% per trade. In practice, there needs to be a further reduction for managing the leverage that will be employed, but let’s leave that to the side for the purposes of this example.
The final step is to estimate how many times we expect the crystal ball to give us useful news. Let’s say it’s 75% of the time. Then, our risk-adjusted wealth grows by 1% for each of the 24 trades we expect to do, resulting in certainty-equivalent wealth 1.27x our initial wealth (1.0124 = 1.27). This tells us that the most we can pay for this crystal ball is 21% of our wealth (1 – 1/1.27 = 21%).
Another useful perspective on the value of the crystal ball is to compare the risk-adjusted value of getting the newspaper in advance once per year versus being able to invest in the stock market for the whole year. The Sharpe ratio of one day’s trades driven by the crystal ball reading is around 0.2 – 0.3 (perhaps much less depending on who is doing the reading) which is less than what most people believe is the typical Sharpe ratio of one year’s worth of investing in the stock market.
Appendix III: Caveats and shortcomings of this study
As with most studies involving paying relatively nominal sums to university students, it’s natural that players’ behavior with a $50 starting bankroll would be very different from how they would use this crystal ball if they could trade on their total wealth.
Players may have done much better if they’d been given company-specific information ahead of time and been allowed to trade individual stocks with that information. Several players told us that they felt the crystal ball would have been much more useful if they knew more about the context of the front page news, in particular what the market was primarily concerned about at the time.
The maximum leverage allowed in our game is higher than most investors can access through futures. However, out-of-the-money options do provide a viable alternative, though with considerably higher costs. Also, we assumed that the players could hold on to their trades until the following day’s close. It’s possible that in some cases, the intraday move in the markets may have wiped out the player’s capital before the next close.
In practice, it is unlikely investors would leverage their total wealth without a limit on the worst-case outcome they could experience. Two effective ways to limit losses from leveraged investments are: 1) putting the trades in a limited liability vehicle, where losses are limited to the capital therein, or 2) buy short-term out-of-the-options to limit the maximum loss on the leveraged trades. Option 1 has the drawback that it may not be possible to get the desired amount of leverage, and Option 2 involves the costs associated with the options contracts.
Appendix IV: The redacted front pages used in the experiment
All the front pages can be seen here, in chronological order: https://elmwealth.com/crystal-ball-gallery/
Further Reading and References
- Andre, P., Schirmer, P. and Wohlfart, J. (2023). “Mental models of the stock market.” SAFE Working Paper No. 406. SSRN.
- Haghani, V. and Dewey, R. (2017). “Rational decision making under uncertainty: Observed betting patterns on a biased coin.” Journal of Portfolio Management.
- Haghani, V. and White, J. (2023). The Missing Billionaires: A Guide to Better Financial Decisions. New York: Wiley.
- Hwang, J. and Lee, D. (2024). “Economic valuation of becoming a superhero.” Journal of Cultural Economics.
- Kelly, J. L. (1956). “A New interpretation of information rate.” Bell System Technical Journal 35 (4). 917-926.
- Koudijsy , P. (2014), “Those who know most: Insider trading in 18th Century Amsterdam.” NBER.
- Kumar, N. and Tetley, L. (June 19, 2024). “Hedge Fund Talent Schools Are Looking for the Perfect Trader.” Bloomberg.
- Levine, M. (November 29, 2024). “Knowing the Future Isn’t That Helpful.” Money Stuff. Bloomberg.
- Merton, R. (1969). “Lifetime portfolio selection under uncertainty: The continuous-time case.” The Review of Economics and Statistics 51 (3). 247-257.
- Nowell, A. (2022). The most desired superpowers around the U.S. TransImpact.
- Xie, C. (2020). “The Signal Quality of Earnings Announcements: Evidence from an Informed Trading Cartel.”
- Many people were instrumental in bringing this experiment and research article to life. Foremost are the contributions of our research associate James Cross, who helped design and single-handedly programmed the Crystal Ball game during the summer of 2023 while still an undergraduate at Princeton. We thank our long-time research collaborator Richard Dewey for his guidance in designing the study and interpreting the results. Jason Zweig of the Wall Street Journal got us off the ground, and introduced us to ASU Professor Rawley Heimer, whose experience in designing and running studies similar to ours was invaluable. We owe a debt of gratitude to our many friends and colleagues, who as always, did their best to clarify and vet our analysis, and in many cases to be guinea pigs for the study: Jerry Bell, Larry Bernstein, Mimi Duff, Fash Golchin, Jessica Haghani, Joshua Haghani, Mark Haghani, Larry Hilibrand, Alex Imas, Spencer Jakab, Agustin Lebron, Saman Majd, Bill Montgomery, Andy Morton, Vladimir Ragulin, Chris Rokos, Jeffrey Rosenbluth and Steven Schneider. If this research has merit, much of the credit goes to them, although all errors are our own. We thank Nassim Nicholas Taleb for his insightful observation that gave birth to this line of inquiry. Finally, our heartfelt thanks go to the roughly 1,500 people who took time from their busy lives to pit their wits and luck against our Crystal Ball challenge.
- 15 days with one stock and bond trading opportunity each.
- Andre, P. et al. (2023). “Mental Models of the Stock Market.” SSRN.
- Despite their relatively strong performance, several of these traders told us they found the game much more challenging than they thought it would be.
- Kumar, N. and Tetley, L. (June 19, 2024). “Hedge Fund Talent Schools Are Looking for the Perfect Trader.” Bloomberg.
- Levine, M. (November 29, 2024). “Knowing the Future Isn’t That Helpful.” Money Stuff. Bloomberg.
- Xie, C. (2020). “The Signal Quality of Earnings Announcements: Evidence from an Informed Trading Cartel.”
- The players who went bust actually finished with a negative balance. The average player return is 0% if we account for the busted players finishing with a debit balance, but of no more than 25% of their starting capital. The average return would go from 0% to 3.8% if we also capped player outcomes at +125% rather than +100%.
- These players seemed to be expressing a view that the WSJ front page from the future held no valuable information. Or perhaps they were heeding another warning from Taleb: “To bankrupt a fool, give him information.” from The Bed of Procrustes: Philosophical and Practical Aphorisms.
- For a fuller discussion of trade-sizing, see chapters 2 – 7 of our book, The Missing Billionaires: A Guide to Better Financial Decisions. Wiley. (2023).
- For Kelly, we use SR / σ, using SR = 0.1, daily σstocks = 1.75% and σbonds = 1.25%, giving us stocks at 0.1 / .0175 = 6x, and bonds at 0.1 / .0125 = 8x.
- Unproctored, but we are confident we can rely on their integrity, and their natural curiosity, to have played the game straight.
- Both expressed in excess of the safe asset return, and with a few other assumptions about random walks, ability to rebalance positions continuously and frictionlessly, and ignoring taxes.
- Twice as risk-averse as implied by the Kelly criterion.
- And that the outcomes are normally distributed, and that he can rebalance his exposure to keep his leverage constant.