September 9, 2024
Investing 101
The Most Important Number Not in The Wall Street Journal
By Victor Haghani, James White and Jerry Bell
Estimated reading time: 3 min.
Announcing a new quarterly market snapshot going out to our research subscribers with long-term expected return estimates for US and global equity markets, plus some other useful bits of information which are also hard to find.
If you’d like to receive it, you can sign up here – and yes, it’s free.
When we think broadly about how to invest, a good starting point is to figure out how much of our wealth we want to invest in major stock markets and how much to keep in safe investments. To make that decision thoughtfully, two major pieces of information we need are the expected return of equities and the return offered on safe assets.1 Even those of us who plan to pick just a handful of stocks, or to invest in private or alternative investments, are well-served by starting off with a clear picture of the returns offered by broad equity markets and safe assets.
From conversations with friends and clients, we’ve become aware of how hard it is to find the information we need to make this most fundamental investing decision. Unfortunately, the essential information investors need is not printed amongst the thousands of prices, returns and other numbers published daily in the Wall Street Journal, or in any other major, broadly-available financial publication. We thought it would be interesting to see whether finance professionals had figured out how to find this information. If we found that even these investors were mostly flying blind, we could reasonably infer that most other investors would be too.
So, a few weeks ago we took the opportunity of a dinner party to poll 19 of our friends, all finance mavens, including three university professors of finance. Our fellow diners had an average of four decades of financial market experience. Spoiler alert: based on the results, we’ve decided to begin publishing this essential information at the end of each quarter.
The Survey
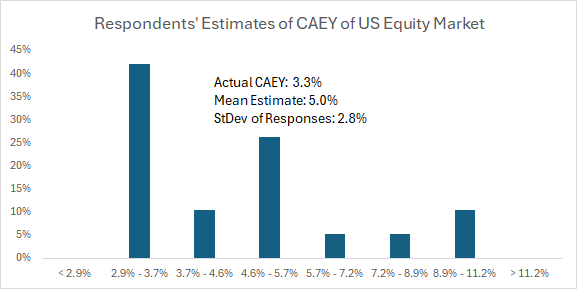
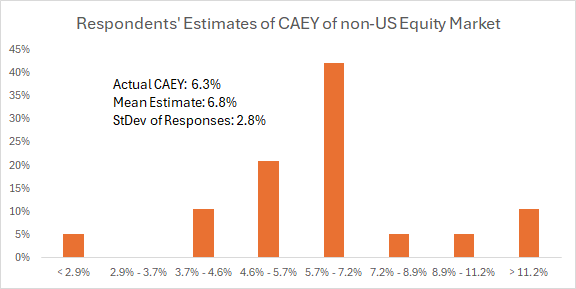
Our first question was to ask for the diners’ estimates of the Cyclically-Adjusted Earnings Yield (CAEY) for the broad US equity market, and the broad non-US equity market.
This question is motivated by our view that the best and most popular estimate of the long-term real return of the broad equity market is its CAEY.2 This metric might be more recognizable expressed as 1/CAPE, where CAPE is the Cyclically-Adjusted Price-earnings Ratio popularized by Professors Robert Shiller and John Campbell. While there’s no universal agreement that CAEY is the best predictor of long-term real equity returns, we’re pretty sure that it is the most popular one used in practice.
At Elm Wealth, our metric of choice is P-CAEY, a variant of CAEY we’ve developed that accounts for most companies not paying out all their earnings as dividends. We’ve written a note about P-CAEY with the full background and details here.
Our dining companions were not especially well-informed about current CAEY levels, as illustrated in the two charts below. While about 40% of the respondents gave a pretty accurate reading, 60% were disturbingly wide of the mark. The standard deviation of the estimates was about 2.8%. This is roughly equal to the standard deviation you’d get from people throwing darts at a board with equal likelihood of all numbers across a range of 0% to 10%.3 In other words, it was as if people had no idea where the CAEY was other than that it was positive and less than about 10%.
Our second question was asking our diners for their estimate of the real yield on 10-year US Treasury inflation protected bonds (TIPS).
We chose the 10-year TIPS yield because it is directly comparable to the stock market return estimate provided by CAEY, which is also a real (inflation-adjusted) return. Also, TIPS are particularly relevant for long-term investors who care more about the lifetime inflation-adjusted spending their wealth can support than about the present value of their wealth. This makes long-term TIPS the safest asset they can buy. We’ve written more about this in our note here.
Our dinner companions did pretty well with this question. The average answer was 1.9%, which was pretty close to the going yield of 2.1% at dinner-time, with 70% of the respondents giving an answer in the range of 2% to 2.5%. The other 30% of the guesses were all lower than 2%, averaging 1.25%. Altogether, it seems like these finance professionals had a pretty good handle on this important piece of information.4
Our plans for making this information available to you
Starting in early October, we’ve been sending a quarterly email to our research subscribers with Cyclically-Adjusted Earnings Yields for broad equity markets and TIPS yields (if you’re receiving this, you’re already signed up. If you think others might enjoy, they can sign up here – and yes, it’s free). Over time, we may add other useful bits which are also hard to find. We also plan to make this information, updated daily, available on our website.
You can piece this information together from other sources, which we describe in the shaded box below. It is our hope that, before long, this information will become widely and freely accessible via the Wall Street Journal, Bloomberg and other popular media sources. It’s hard to see how investors can make sensible, informed decisions without having forward-looking estimates of stock market and safe asset returns.
Other sources for TIPS yield and CAEY
Bloomberg: United States Rates & Bonds, or a Google search for “10 year TIPS yield” should take you to the St. Louis Federal Reserve page or to Treasury Direct, which both give a pretty up-to-date reading.
You can find Shiller’s version of CAPE in a spreadsheet he makes available on his website.
For non-US equity markets, Barclays publishes current and historical CAPE values here. The CAEY for these markets is equal to the reciprocal of CAPE figures provided.
- Metrics of risk and risk-aversion are important as well, as we discuss in our book The Missing Billionaires. In this note, we focus on the return of equities and safe assets because we believe those are inputs for which generally-accepted metrics are available using public information, but are not regularly published in major media outlets.
- An alternative approach taken by some investors is to extrapolate from past stock market returns. We aren’t fans of this approach, as we don’t believe the past is generally a good predictor of the future in the domain of investments, especially when a forward-looking estimate of the expected return of the stock market is available in the form of CAEY. Another approach, embraced by most wall street stock research departments, is to make an estimate by blending a range of subjective factors, including estimates from the first two approaches above. This might be the best approach if only the experts could agree (or if an average of these estimates were published on a consistent basis). Another short-coming is that these experts tend to focus on estimating short-term stock market returns, which is extra challenging, and if followed would lead to wild swings in investor asset allocations. It would also help if the experts making these estimates were free of the conflicts that arise from them working at firms that are more profitable when their clients invest more in stocks and when the stock market goes up.
- The standard deviation of a uniform distribution is (U – L)/√12, where U is the upper end of the range and L the lower end. (10% – 0%)/√12 = 2.9%.
- Our dinner took place in London, and so we also asked for estimates for the yield on 10-year UK inflation-linked bonds. Our friends’ guesses were far less accurate, which reflects the fact that these yields are surprisingly difficult to find in the public domain.