November 15, 2022
Investment Theory
Who Wants Protection Like This?
By Victor Haghani and James White 1
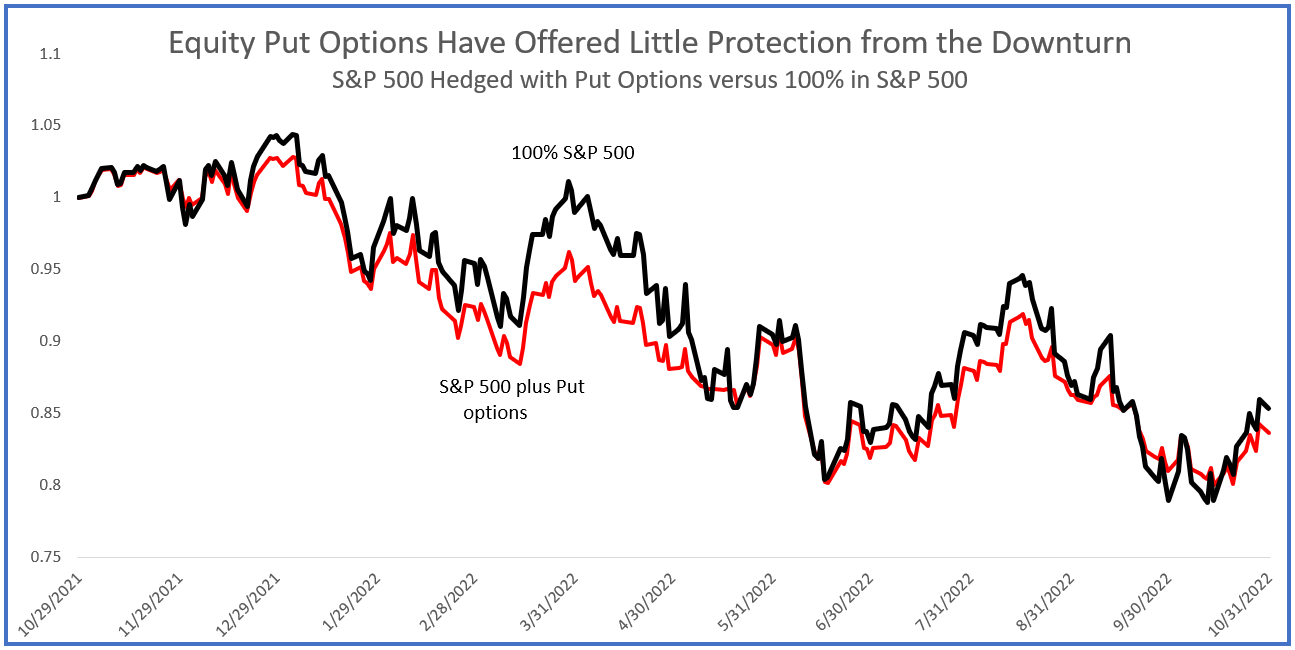
The S&P 500 is down 15% over the past year,2 so you’d think this would have been a great time to own some protection on your portfolio. Unfortunately, that’s not how things have turned out in this bear market (at least not yet) and not for what is probably the most popular way of protecting a stock portfolio with options.
Your Money or Your Time? It Hurts to Lose Both
If you bought and rolled one-month put options on the S&P 500 to hedge an investment in that index, over the past year you’d have lost an extra 2% on top of the 15% loss from just holding the S&P 500 unhedged, not to mention the loss of your time spent managing the strategy. The Chicago Board Options Exchange (CBOE) makes this really easy to see, by publishing an index of daily returns on the S&P 500 hedged by buying and rolling 5% out-of-the-money put options. The index ticker is PPUT.3
A more apples-to-apples comparison would be the put-protected S&P 500 versus just owning less stocks. As the chart below shows, if you’d kept 65% of your portfolio in stocks and 35% in T-bills, roughly consistent with the average risk level of 100% stocks fully protected with put options, you’d have outperformed the hedged strategy by about 8% over the past year.
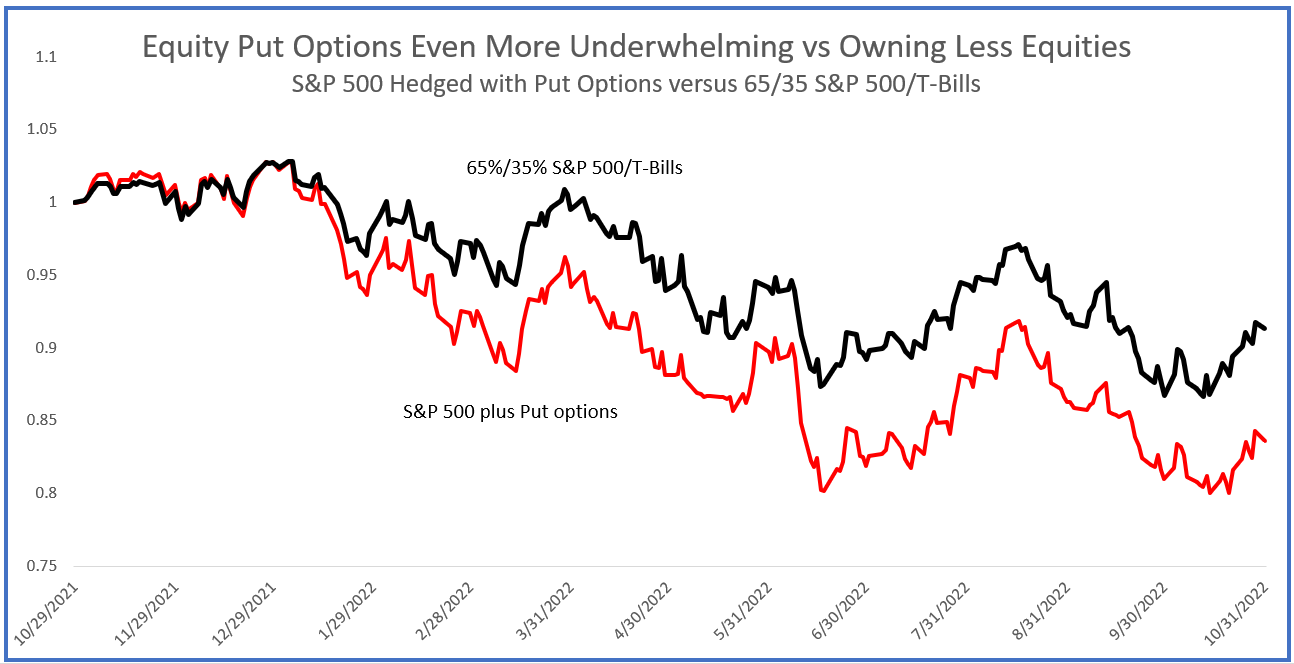
We’re not suggesting that when the stock market goes down, an options-protected portfolio will always do worse than both a 100% long portfolio or one with a reduced equity exposure. But, we are focusing on the experience of the past year to make the point that options are not a silver bullet and do not provide “for-sure protection”. Even in a bear market, a portfolio protected with options will not always do better than an unhedged portfolio, and can do a lot worse than one that protects itself by simply owning less equities.
Just Unlucky?
Yes and no.
Yes, the main reason for the poor relative performance of the put-protected portfolio over the past year is some unlucky timing of when the options were purchased and expired and the exact path the market took over the year.
And no, there’s also a sense in which this outcome wasn’t just a uniquely bad throw of the dice. There are several fundamentally unattractive features of protecting your portfolio with short term put options. One is the fact that it’s nearly impossible to know whether the options you’re buying are fairly-priced. Another is that the options strategy reduces desirable time diversification, which in turn reduces Sharpe Ratio4 relative to keeping a constant fraction in equities.5
Options and Time Diversification
Time diversification is reduced because the exposure to stocks from a put-hedged portfolio will vary quite dramatically over time – some periods of higher exposure and others of lower exposure mean there are fewer “important” days determining total periods returns, thus lower diversification. When the options are purchased, the effective market exposure will be around 65%. But, if the market drops and the options are deep in-the-money, the exposure will drop to close to nothing – or, if the market is well above the put option strike price the portfolio might have close to 100% exposure. We can see the reduced diversification through risk metrics too: a portfolio that has 100% in the stock market half the time and 30% in the market the other half the time will have volatility about 15% higher than that of a portfolio with a constant 65% exposure.6
So, even if the portfolio protected with put options has the same expected return as a portfolio that just owns less stocks, the risk of the protected portfolio will be higher and therefore the expected Sharpe Ratio will be lower.7 This is borne out by the long-term historical data for the PPUT index. From 1986 to present, the simpler portfolio of 65% in the S&P 500 and 35% in T-Bills had a 0.6% per annum higher return, lower risk, and a Sharpe Ratio which was 22% higher compared to the PPUT strategy.8 That 22% higher Sharpe Ratio actually represents nearly 50% more expected welfare, because not only would you have earned a 22% higher excess return for the same risk, but in addition, you should have wanted to have 22% more of the simpler stock/T-Bill portfolio than the put-protected portfolio strategy, since the quality of the former was higher. The result: twice as much improvement in your expected welfare.
When Do Options Help?
We recently co-authored an article with our friend Vladimir Ragulin, titled “Do Options Belong in the Portfolios of Individual Investors?” (Journal of Derivatives Spring 2022)
Our conclusion was that options are unlikely to be welfare-enhancing, let alone a panacea, for affluent individual investors with typical risk preferences in most circumstances. We know this is a pretty strong conclusion, given that options trading now rivals stock trading in daily volume. You’d think that must be a sign that a lot of people are benefiting themselves through all that voluntary trading. But on the other hand, a lot of money gets put down on tables from Vegas to Macau, and so perhaps we shouldn’t find it so shocking that there’s so much options trading even though it is a zero-sum game, or worse after transactions costs.
- This not is not an offer or solicitation to invest, nor should this be construed in any way as tax advice. Past returns are not indicative of future performance.
Thanks to Vladimir Ragulin for his help with this article.
- To the end of October 2022.
- You can find the data on the CBOE website here.
- A simple measure of the quality of an investment, the Sharpe Ratio is the ratio of an asset’s return in excess of the risk-free rate divided by its standard deviation of returns.
- Assuming stock market returns are normally distributed and the options are fairly priced. This is a pretty strong result which will hold under a fair bit of deviation from these assumptions.
- The portfolio that spends half its time at 30% and half at 100% exposure to the market has volatility, σ, equal to √(.5 * (0.3 * σ)2 + .5 * (1.0 * σ)2), which is 14% higher than the 0.65 * σ for the portfolio with a constant 65% in the stock market.
- And, in case you’re wondering whether doing the opposite would be better, this loss of time diversification argument also weighs against the sometimes popular strategy of selling put options.
- The CBOE also publishes an index of returns from selling one-month 2% out-of-the-money put options (PUTY), which can be used to figure out how a portfolio protected with those put options would have done. The result since 1986 is pretty much the same as that for 5% out-of-the-money puts– lower return and lower Sharpe Ratio than a portfolio holding less stocks with about the same average exposure to the market.